So that’s another day done, and it’s been a pretty good day from an intraday trading perspective in the bitcoin price. We noted this morning that we would like to see lots of movement, and while it’s always nice to see some upside momentum from a long term perspective, intraday doesn’t really necessitate a short term bias. Today’s action came to the upside, and we were able to get in to the market on a break of our predetermined resistance level. A quick run through off the back of the break carried us to our target nice and easy, and we got in and out for a quick profit.
We’ve not managed to get to 800 yet, but we’re nearly there.
With any luck, we’ll see a similar degree of volatility as we head in to the close of the US session this evening, and beyond that, in to the Asian session early morning.
So, with this said, let’s take a look at what’s going on, and we we are looking to get in and out of the markets on any forward volatility. As ever, take a quick look at the chart below to get an idea of what we are focusing on. It’s a five-minute candlestick chart and it’s got today’s action illustrated as it intertwines our key levels.
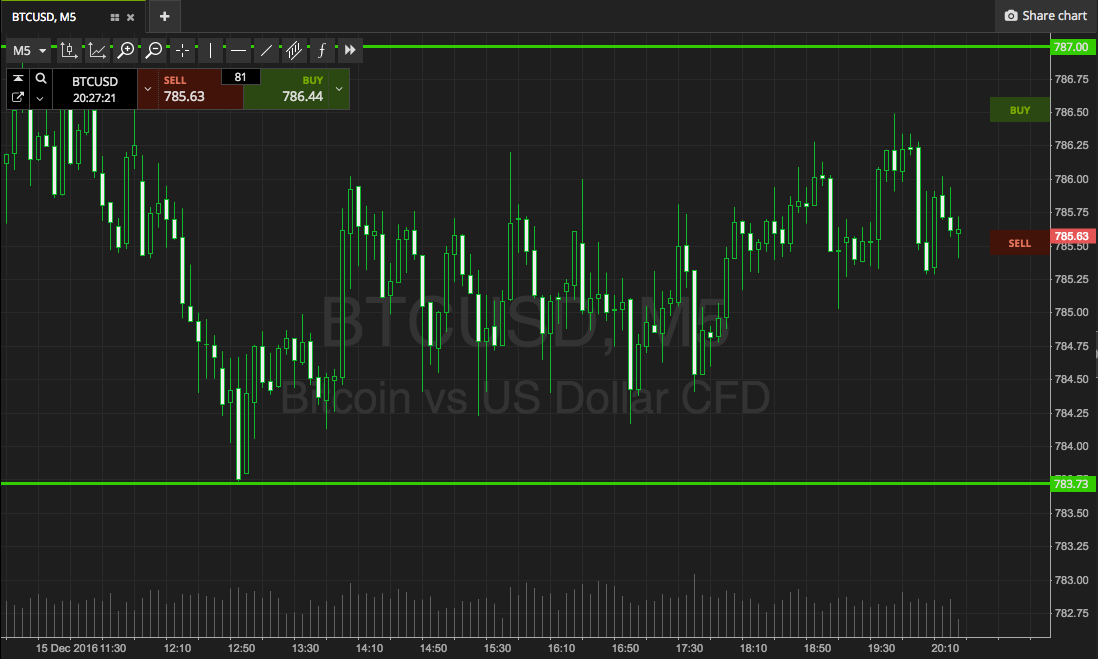

As illustrated, we’re looking at support to the downside at 783 flat, and resistance to the upside at 787. Breakout only for this evening – action is a little too volatile for us to risk a chop out on the intrarange strategy.
So, a close above resistance will put us in a long position towards an immediate upside target of 790. Conversely, a close below support will put us short towards 775 initially. Stops just the other side of the entry to manage risk.
Let’s see how things pan out.
Charts courtesy of SimpleFX