Unlike last week, when we tried to incorporate a range of technical charting patterns into our bitcoin price trading strategy, this week’s strategy has been pretty straightforward. When we see s sustained directional bias (in this case, to the upside) it’s often just a matter of stepping up the key levels with each new formation swing high, and rerunning the same approach – similar distance targets, tights stops, nothing too aggressive. In yesterday’s analysis we set up against a potential upside break, and overnight we got the break – not without a brief downside correction, however, but a break nonetheless. A short while ago some decent volume on the European open boosted the bitcoin price a little more, and we now sit just shy of intraday highs at 423.5.
In light of the recent action, and in line with what we’ve just discussed, we’re just going to shift our levels around and play to the directional bias throughout today’s session. So – with this said – let’s get to the strategy. As always, get a look at the chart below to get an idea of what we are looking at.
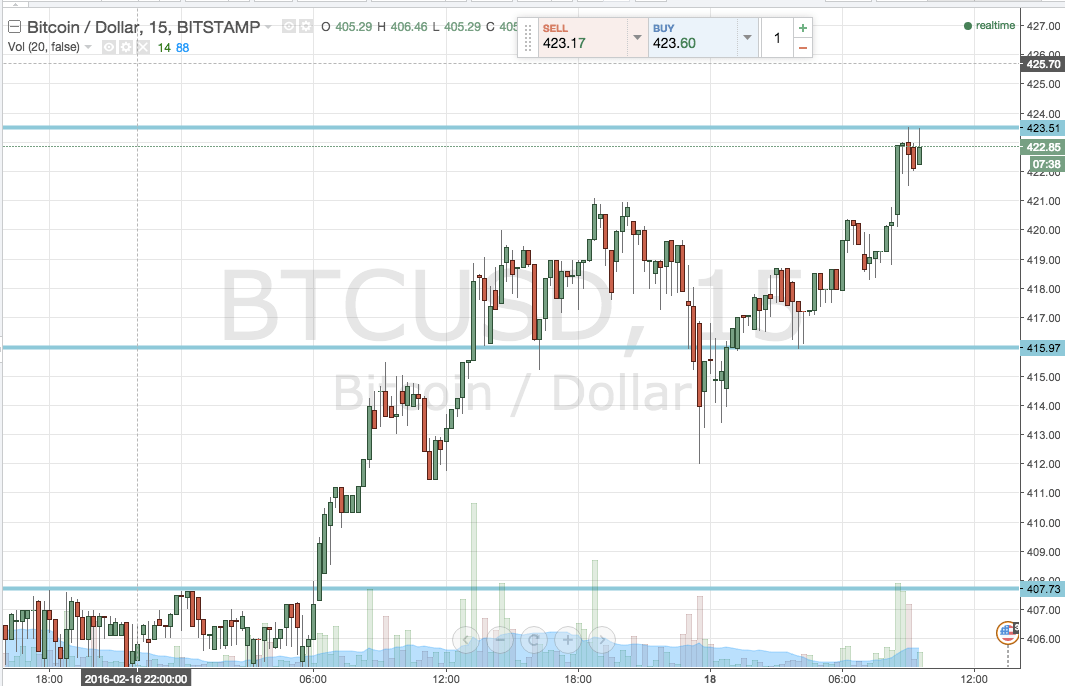

As the chart illustrates, the two key levels that define today’s range are in term support at 416 flat to the downside and in term resistance to the upside at the already mentioned swing high of 423.51. These two levels will be the ones to keep an eye on from a breakout and intrarange perspective.
If we close above resistance, we’ll go long towards an initial upside target of 428 flat. A stop at 421 keeps risk tight.
A close below support will put us short towards 407 (marked), and a stop on this one somewhere in the region of 418 works well.
Intrarange, long at support and short at resistance, with a stop just the other side if the entry protecting the downside.
Charts courtesy of Trading View