It is Thursday morning, and time to take the first of our twice daily looks at the bitcoin price. Things have been pretty active over the last few days, and this has given us plenty of opportunity to get in and out of the markets according to our intraday strategy. Overnight, we got a pretty decent breakout, and scalped a few dollars off the top of the market. This has caused two things to happen. First, we are net up on the market for the week, and look in a strong position to head into the close. Second, we have a nice new range defined, and we can use this range to approach the morning session out Europe today. So, with this in mind, and as we head into a fresh session today, here is a look at what we’re going for in the bitcoin price, and a description of our intraday strategy moving forward.
As ever, take a quick look at the chart below to get an idea of the levels in focus for today’s session. It is a five-minute candlestick chart, and it has the levels in focus overlaid in green, showing the last 12 hours’ worth of action.
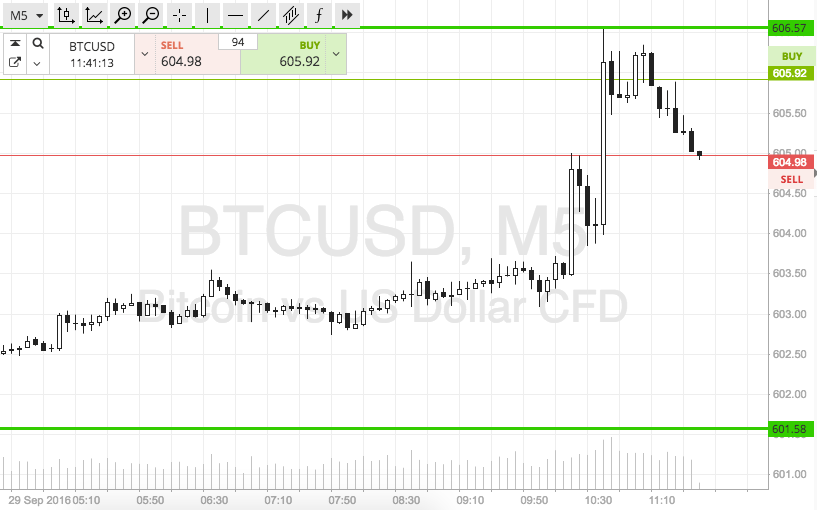

As the chart shows, the range in focus for today is defined by support to the downside at 601, and resistance to the upside at 606. With around five dollars’ worth of room to play with, we are not going to be trading intrarange today – at least, not for this morning’s session.
Instead, we are looking for a break above resistance to validate an upside entry towards 610. A stop loss on this position somewhere in the region of 604 works well to define risk. Conversely, if price breaks below support, we will get in short towards 595. Again we need a stop loss, and somewhere in the region of 603 looks good.
Charts courtesy of SimpleFX