So, we have come to the middle of the week, and it seems like not much has happened from an intraday perspective in the bitcoin price today. This likely has something to do with the long weekend out of the US, but any hangover effect from Monday’s low volume should ease up at some point today, and as such, we should get a return to some solid price momentum. It is getting pretty boring to just reiterate our key levels time after time, but when price trades sideways within such a narrow range it’s difficult to switch things up that much without breaking the rules of our strategy. Having said this, there is something we can do, and that is to narrow the time frame of our analysis. So, with that said, we are going to shift from a 15 minute chart to a five-minute chart, and see if we can go for some slightly tighter scalp targets on any volatility. take a look at the chart below to get an idea of what we’re focusing on this morning and to see how the time frame switch has affected our charting.
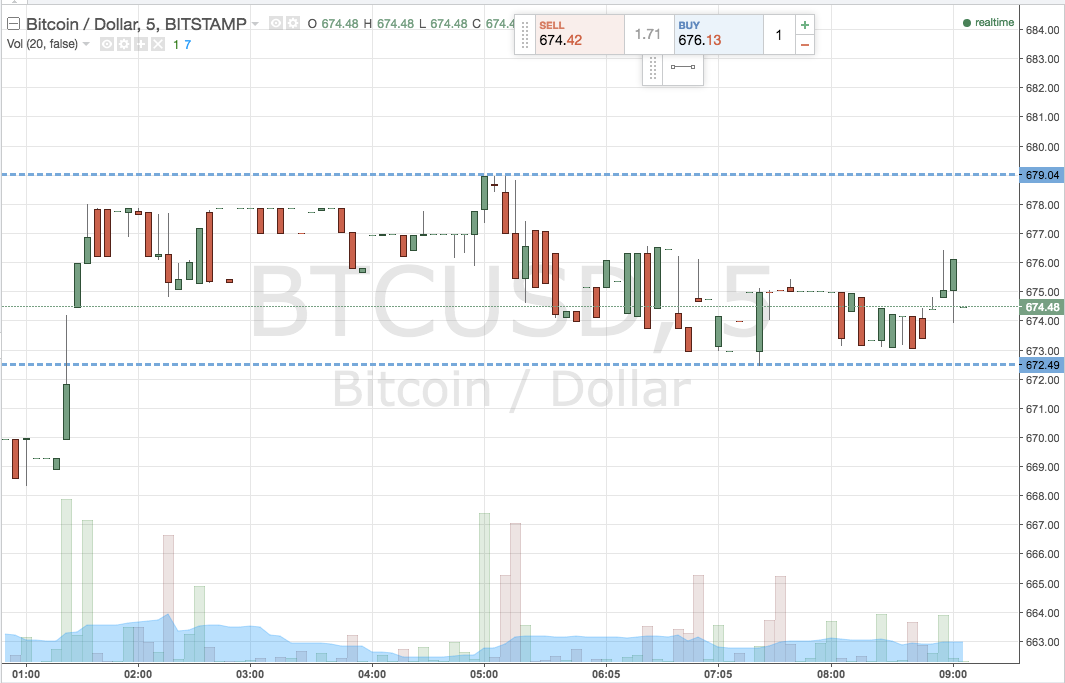

As the chart shows, our range for today is defined by 672 to the downside as support, and 679 to the upside as resistance. Normally, we don’t like to trade with anything tighter than a $10 range. In this instance, however, we’re going to give it a go. With this in mind, intrarange is off the table today. It is too tight a parameter for us to effectively take advantage of any scalp trades while maintaining a decent risk reward profile.
So, with just our breakout strategy in play, we will look to enter long on a close above 679 towards an initial upside target of 684. A stop loss at 677 will define risk. Conversely, a close below 672 will signal short toward 668. A stop loss at 674.5 keeps things tight and will ensure we are taken out of the trade in the event of a bias reversal.
Charts courtesy of Trading View