That’s it! Another week gone. Things have been volatile in the bitcoin price this week, which has definitely worked to our advantage. We’ve managed to get in and out of the markets on a number of occasion over the last few days, and our scalp breakout strategy has served us pretty well. We are set to close out the week net positive (unless something disastrous comes around this evening, which it shouldn’t, so long as we keep our risk management standards in place), and hopefully we’ll get a continuation of the week’s volatility across the weekend.
So, without further ado, let’s get to the details.
As ever, take a quick look at the chart below to get an idea of the levels we are focusing on, and how we came to these levels based on the action seen throughout today’s European session. It’s a five-minute candlestick chart with about twelve hours’ worth of action displayed, and it’s got our range overlaid in green.
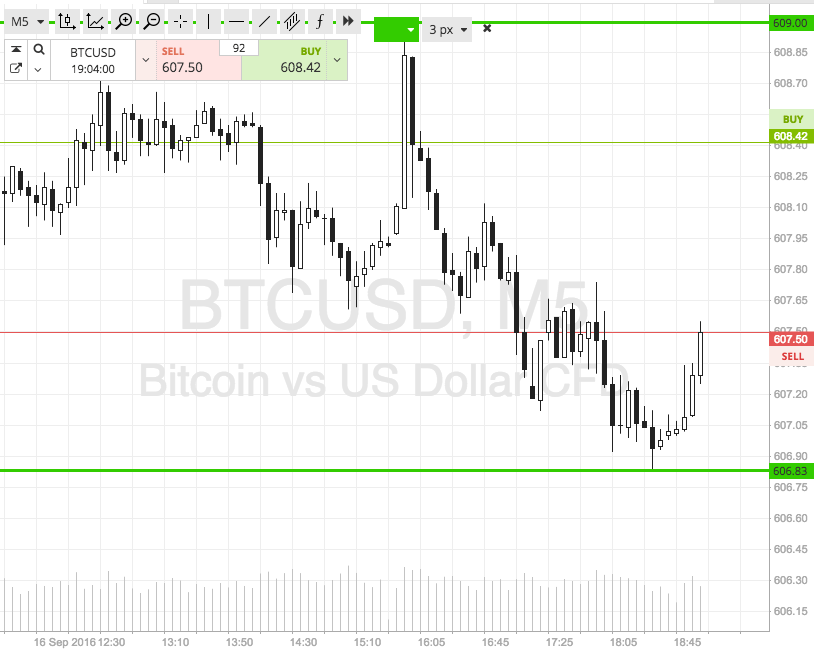

As the chart shows, the range we are working with this evening is defined by in term support to the downside at 606, and in term resistance to the upside at 609 flat. This is a super tight range, so we’ll be sticking with our breakout strategy. Intrarange doesn’t give us anywhere near enough room to go at price from a risk management perspective, so that’s out of the window for now.
If price breaks through in term resistance, we will look to get in long towards an immediate upside target of 615 flat. A stop loss on this trade somewhere in the region of 607 will keep our risk tight on the position and ensure we will get taken out of the trade in the event that price reverses and returns to trade within our range.
Looking south, a close below support signals short towards 600 flat. Stop at 608 on this one.
Happy trading!
Charts courtesy of SimpleFX