
The day is just about to draw to a close out of Europe, and once again we’ve had a pretty busy one in our bitcoin price trading operations. Volume remains up and we are getting plenty of opportunities to get in and out of the markets on the action we are seeing. Yesterday we looked at a standard intraday pattern – one that crops up pretty regularly as indicative of a longer term reversal indication in the more traditional financial asset markets. Today, we haven’t seen any traditional patterns (incidentally, and as those who followed along yesterday will know, the head and shoulders we saw yesterday didn’t play out as hoped) but we have seen enough to give us a nice solid range heading into the session this evening. We are going to use this range to attempt to carry forward our good fortune in to the late US afternoon and – beyond that – into the Asian session tonight.
So, with this said, let’s take a look at what we are focusing on. Get a quick look at the bitcoin price chart below to see what’s important before we get down to the nitty gritty.
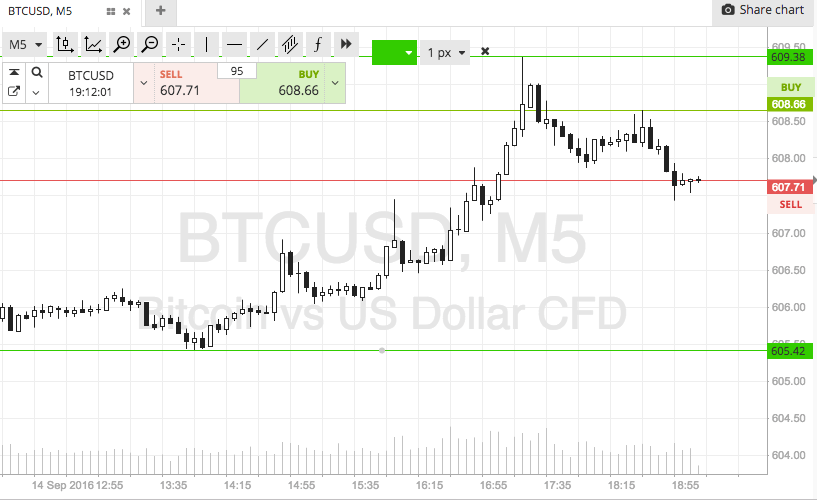
As the chart shows, the range we are looking at this evening is defined by in term support to the downside at 605 and in term resistance to the upside at 610. Things have been pretty tight recently, and so our range reflects this situation.
We are going to go at price using just our breakout strategy.
Specifically, if we see price break above in term resistance, we will look to enter a long position towards a target of 615. A stop loss on this one at 607 will define risk and ensure we are taken out of the trade if price reverses.
Conversely, a close below support will signal short towards 600. Again we need a stop, and somewhere in the region of 607 again looks good.
Happy Trading!
Charts courtesy of SimpleFX