This afternoon’s analysis is going to be pretty straightforward. If you were with us a little earlier on this morning, and caught the first of our twice daily bitcoin price watch pieces, you’ll have seen our interpretation of last night’s action. Basically, and to quickly recap, we noted that the bitcoin price had reached its highest level in a while overnight, and as we edge up upon the 450 flat mark, we may see some consolidation, both as speculators take profits and as the psychologically significant levels weighs on bullish sentiment. Action has now matured throughout the morning session, and our expectations have played out pretty much as forecast. Price has remained well within the range we slated as the one to watch this morning, and while we’ve had the odd test to the upper boundary, no breaks have occurred, and as such, we’ve not had any opportunities to enter in either direction.
This isn’t necessarily a bad thing. When we stay out of the markets at least we can’t lose money! It’s always nice to be in a trade, however, so as we head into this evenings session in the US and beyond that into Europe, what are we looking at?
The chart below illustrates the key levels for tonight. As usual, it’s a fifteen-minute timeframe candlestick chart.
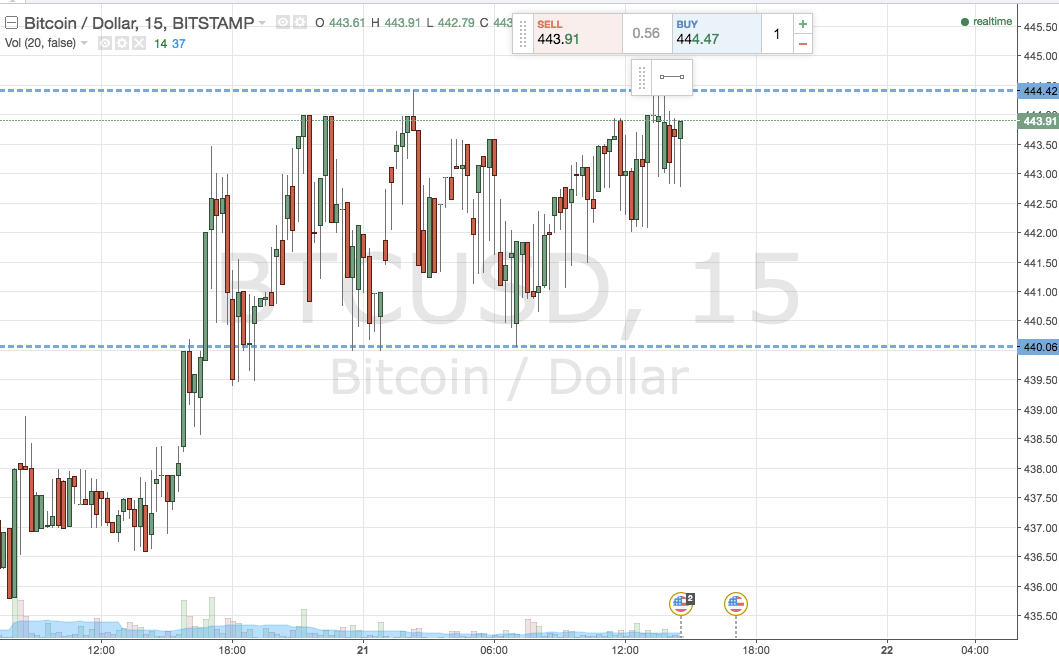

One look at the chart and you’ll see why we said our strategy is straightforward – it’s an exact replica of this morning’s approach! Since we didn’t break any key levels, there’s no need to shuffle things around, so we’re still looking at in term support as defined by 440 flat, and in term resistance to the upside at 444.5.
A break above resistance signals long towards 450, with a stop at 442.5. A break below support puts us sort towards 435 – stop at 442 flat to define risk.
Charts courtesy of Trading View