That’s another day’s trading complete in our bitcoin price trading efforts and what a day it has been. We noted this morning that the correction that was playing out in the bitcoin price overnight was likely a short to medium-term correction and that we would be on the lookout for a reversal of the trend throughout the session today.
It didn’t take long for this reversal to come into play.
Shortly after we published our first analysis this morning, price reversed in and around the 4000 flat mark and quickly ran up to 4300. We are currently in and around this level now and, instead of wasting any more time detailing how things played out during the session today, we are going to jump in and get some levels outlined with which we can carry forward into the session this evening. As ever, take a quick look at the chart below before we get started so as to get an idea of what is on and where things stand right now. It is a one-minute candlestick chart and it has our key range overlaid in red.
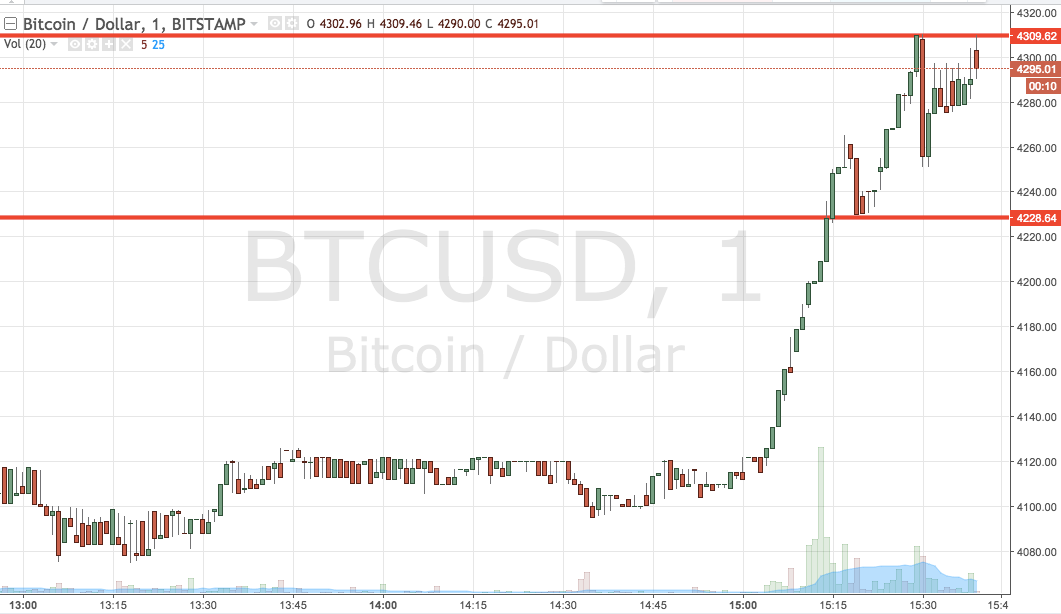

As the chart shows, the range we’re looking at this evening is defined by support to the downside at 4228 and resistance to the upside at 4309. Standard breakout rules apply for the session, so we will look for a close above resistance to validate an immediate upside target of 4350. A stop loss on the trade somewhere in the region of 4300 flat will ensure that we are taken out of the position in the event of a bias reversal.
Conversely, and looking the other way, if price closes below support, we will get in short towards 4200 flat. This one’s slightly less aggressive, so we need a tighter stop loss and somewhere in the region of 4230 looks good.
Chart courtesy of Trading View