So we are coming to a close of the first day of the week in the bitcoin price market, and it’s time for us to take a look at how action during today’s session has impacted on out strategy. Further we need to address how this impact is going to play out this evening from our point of view. So, without further ado, let’s get to the details.
First, a quick look at today’s action. The chart below shows the action seen in todays market (it’s clean, we’ll add some key levels shortly).
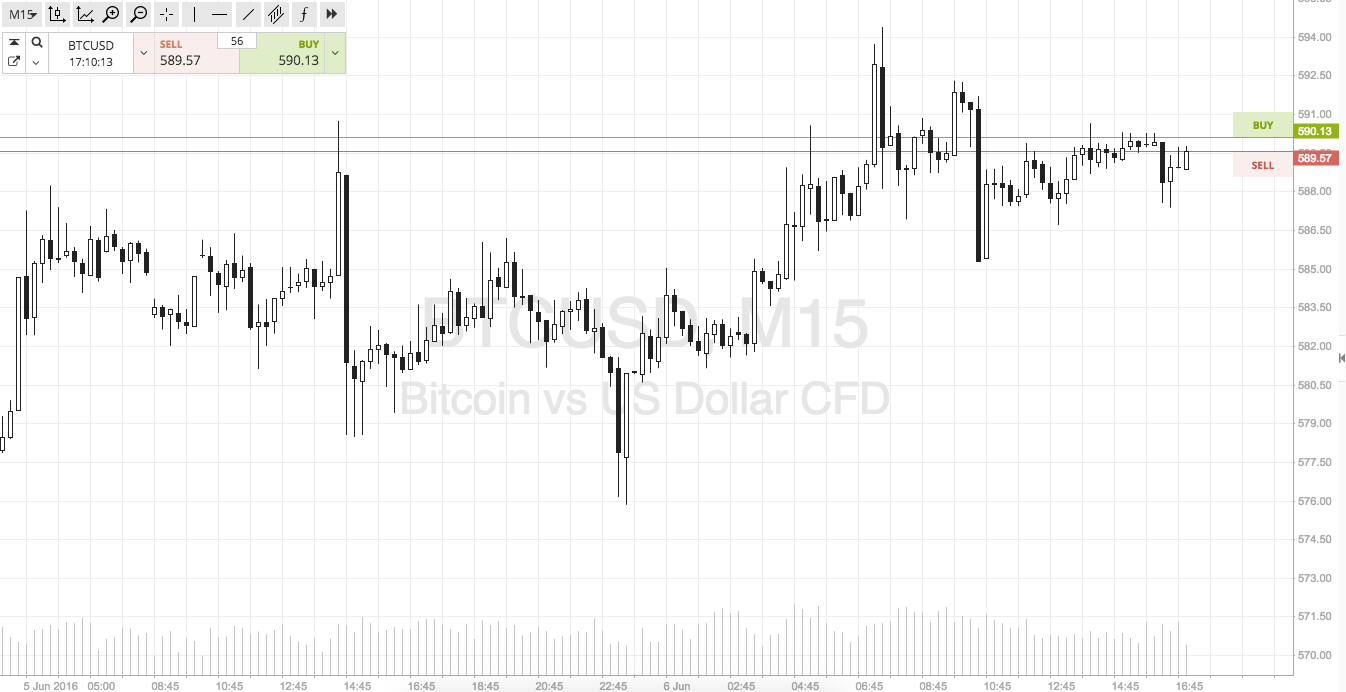

So as the chart shows, action today has been somewhat mute. We did get a bit of a kick to the upside this morning (very early Europe) but this kick quickly reversed, and the reversal carved out daily lows around 585 midday. Since then, price has traded pretty flat, with a slight upside bias.
Moving onto this evening, take a look at the second chart below. It’s an intraday chart showing the same action that the first chart above illustrates, however it includes some key focus levels for this evening.
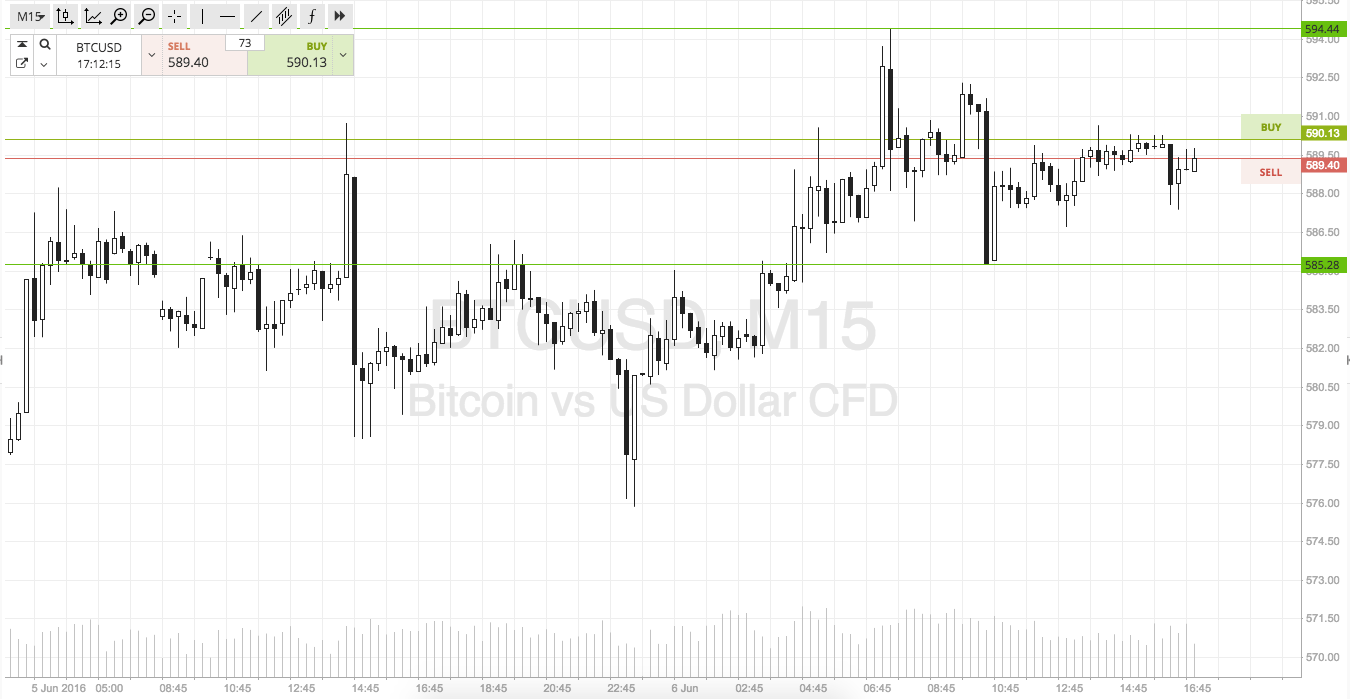

As the chart shows, the range we are looking at for this evening’s session out of Europe is defined by in term support at the aforementioned intraday lows – 585 – and, to the upside, in term resistance at the also mentioned intraday highs – 595 flat. With about ten dollars to play with, there’s plenty of room for an intrarange approach. Long at support, short at resistance, you know the drill by now.
Looking at breakout, if price closes above resistance it will signal a long entry towards an initial upside target of 600 flat. This is pretty conservative, but 600 is likely going to offer up some strong psychological resistance, so caution is valid.
Looking short, f price closes below support we will enter short towards 580. Stop at 587.
Charts courtesy of SimpleFX