So that’s another day done for our bitcoin price trading, and what a day it’s been. This morning we noted that we might see some sideways action heading into the weekend, and that the low volume that should come about on the back of the Easter break in Europe and the US would likely keep things muted, if not a little bit choppy.
How wrong we were.
Shortly after we put out our first analysis, the bitcoin price collapsed, and broke through the 1200 level that we had slated as potentially serving as long term support for the market. It then continued to drop, and fell as low as 1140 on the intraday charts before correcting a little bit on the bounce to trade in and around current levels of 1160.
We’re going to use these levels going into tonight’s session. On the bright side, and as a quick note before we get to the detail, we actually managed to pull a quick profit from the market on the initial break. After that, however, things left us behind.
So, with that noted, let’s get to the real stuff.
As ever, take a look at the chart below before we kick things off. With action as it has been today, we’re going to widen our timeframe out to the fifteen-minute chart (as opposed to our standard five-minute chart) and this has the impact of a wider range than normal.
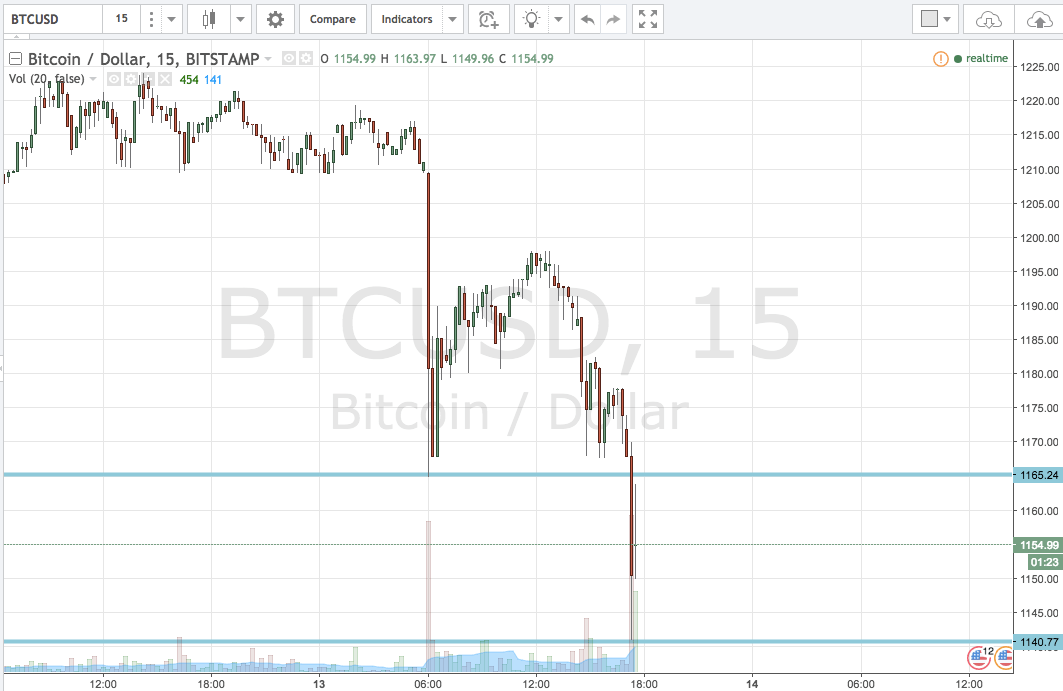

Stops, as ever, just the other sides of the entries to define risk.
Charts courtesy of TradingView