It is Monday morning and it’s time to take a look at what happened overnight in the bitcoin price in an attempt to figure out how we can use the action we have seen to formulate a strategy going forward. With any luck, we will see a continuation of the overarching upside momentum that brought price to trade at current levels. Action right now is serving up something of a short-term correction but, as we’ve just said, hopefully, this will prove exactly that – short term – and the dip will prove a nice buy opportunity as things progress.
So, with this noted, let’s get some levels in place that we can use near term. As ever, take a quick look at the chart below before we get started so as to get an idea where things stand and where we are looking to jump in and out of the markets according to the rules of our intraday strategy. The chart is a one-minute candlestick chart and it has our range overlaid in green.
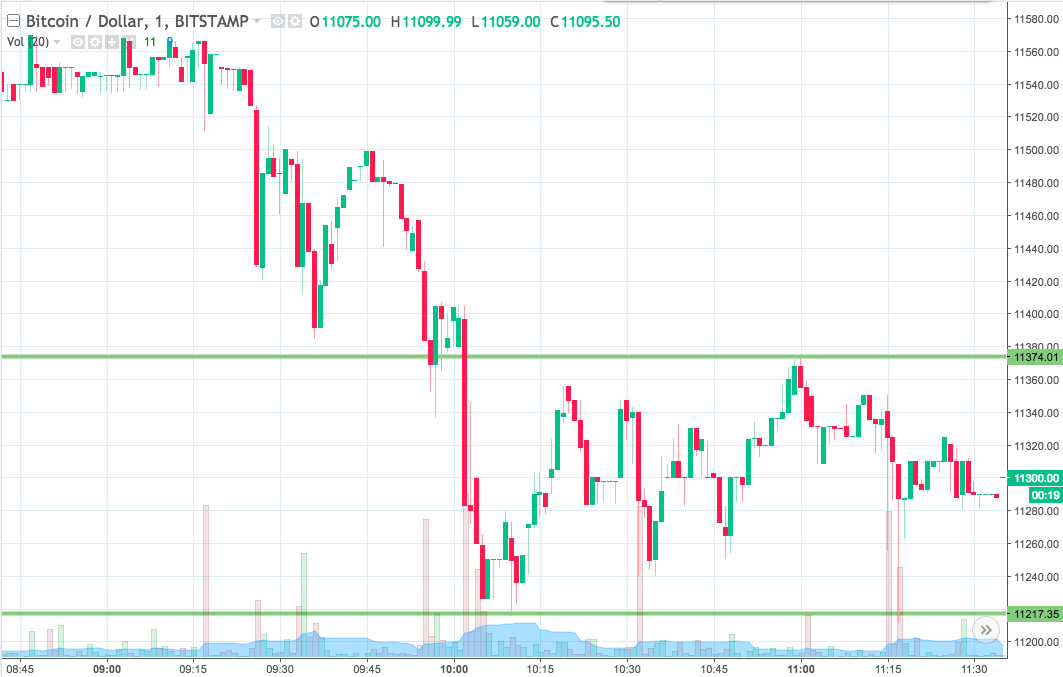

As the chart shows, the range we’re looking at for the session this evening comes in as defined by support to the downside at 11217 and resistance to the upside at 11374.
We are going to stick with our standard breakout strategy, for the time being, so we will look at getting in long towards an immediate upside target of 11440 if we get a break and a close above resistance. A stop loss on the trade at 11350 will ensure things remain tight from a risk management perspective.
Looking the other way, if price closes below support, we will enter short towards a downside target of 11160. A stop loss on this one in and around 11230 looks pretty solid.
Now we wait and see how things play out…
Charts courtesy of Trading View