The bitcoin price has been moving fast and hard over the last 24 hours or so. With the fork approaching, companies are clarifying their positions and – in some cases – the clarification is translating to an increased degree of uncertainty surrounding how things are likely to play out long term.
In turn, this uncertainty is resulting in some pretty rough volatility – something that can be both a good and a bad thing when it comes to intraday trading.
If we get movement, it means we see plenty of entry opportunities. However, if we aren’t careful, these opportunities can turn against us pretty quickly and we can get chopped out of the market.
All this means is that we have to make sure we have our strict risk management principles in place before committing to any positions.
So, with this noted, let’s get some levels in place that we can use to navigate the markets today. As ever, take a quick look at the chart below before we get started an idea where things stand and where we are looking to jump in and out of the markets if we get any action during the European session. It is a one-minute candlestick chart and it has our range overlaid in green.
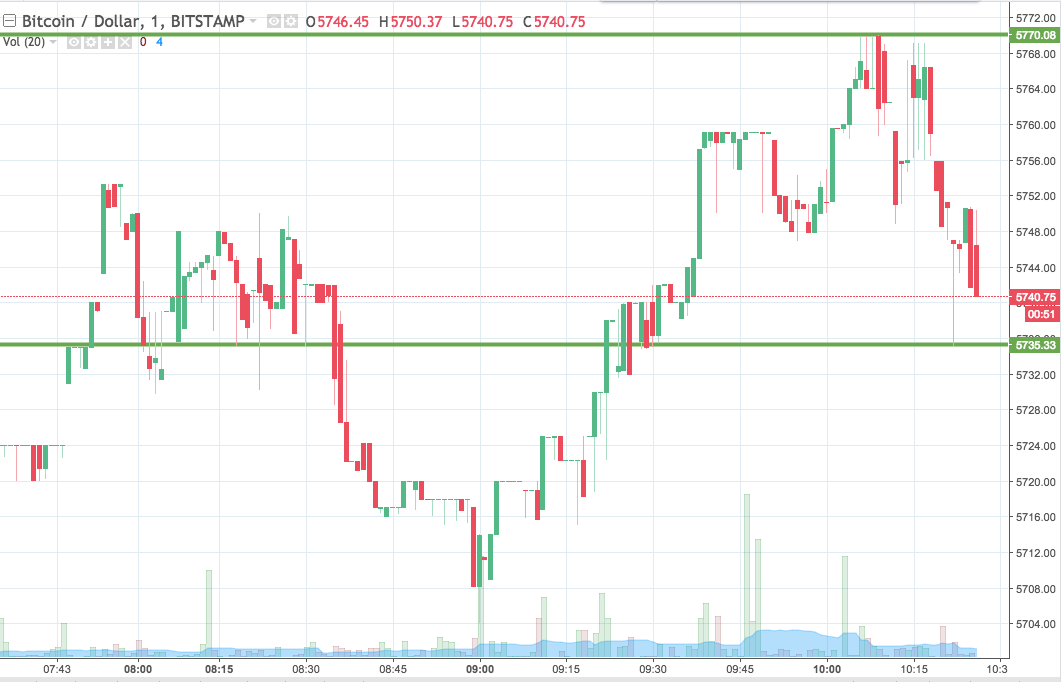

As the chart shows, the range we are using for the session today comes in as defined by support to the downside at 5735 and resistance to the upside at 5770.
Our first trade will come if we see a close above resistance. On said close, we will enter long towards an upside target of 5810. A stop loss on the position at 5760 works to define risk nicely.
Looking the other way, if we get a close below support, we will enter short towards downside target of 5700. A stop loss on this one at 5745 looks good.
Chart courtesy of Trading View