Another day, another opportunity to draw a couple of dollars from the bitcoin market on any volume induced volatility. That’s the saying, right?
Well, it’s what we’re going to try and do today. The week so far has been mixed. We got9 a running start after a great weekend, but then price essentially died overnight on Tuesday/Wednesday (died as in remained flat, it didn’t crash or anything like that) and we didn’t manage to get in to anything for a few hours. Wednesday afternoon, however, price did crash (on the intraday charts) and we managed to get in short and take out a nice downside target on the action.
We’ve got a fresh session ahead of us today, and so with this in mind, and moving into the European morning, let’s take a look at what we are going for in the bitcoin price, and see if we can’t set up some levels that will help us draw a profit from the action.
As ever, take a quick look at the chart below t get an idea of where things stand. It is an intraday, five-minute char showing the last twelve hours’ worth of overnight action, and it has our key levels overlaid.
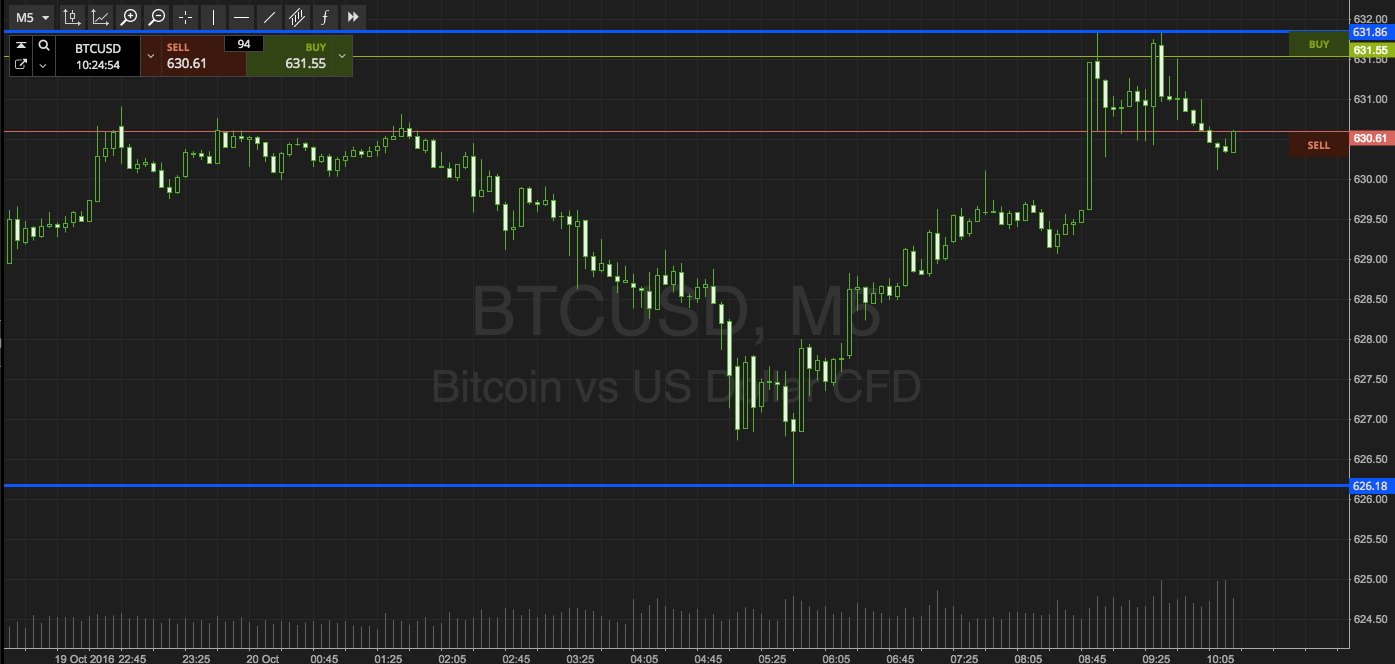

As the chart shows, the levels in focus for this evening are in term support to the downside at 626 flat, and in term resistance to the upside a little higher at 631. Breakout strategy only this morning, as there’s nowhere near enough room to be going at price intrarange given the current bid ask.
So, if price breaks above resistance, we will look to get in long towards an immediate upside target of 637. A stop at 629 defines risk on the position.
Conversely, a close below support will signal short towards 620, and we’ll get in with a stop at628 to manage our risk.
Happy trading!
Charts courtesy of SimpleFX