So we’re off to a fresh week’s trading in the bitcoin price, and with any luck, we’ll get a repeat of the action we saw during last week’s sessions. Volume picked up on the back of raised participant rates, and the frequency of breakout entry opportunities increased. Not only that, but the momentum driven by the volume increase meant that we saw a few nice sustained movements on our entries, and this enabled us to get in and out according to our intraday strategy and stay in until our take profit hit. Those who have followed us for a while will know we have had some difficulty with our take profits over summer. Not difficulty in the sense that we haven’t bee able to get in and out profitably, but that because of the lack of volume (and the resulting lack of any real follow through on breakouts) we’ve had to use really narrow targets. This now seems to be resolved, so… Onwards!
Let’s get to the important stuff.
As ever, take a quick look at the chart below before we get started to see the levels in focus, and also what happened over night in the bitcoin price.
The chart is a five-minute candlestick chart and it’s got our range overlaid in green.
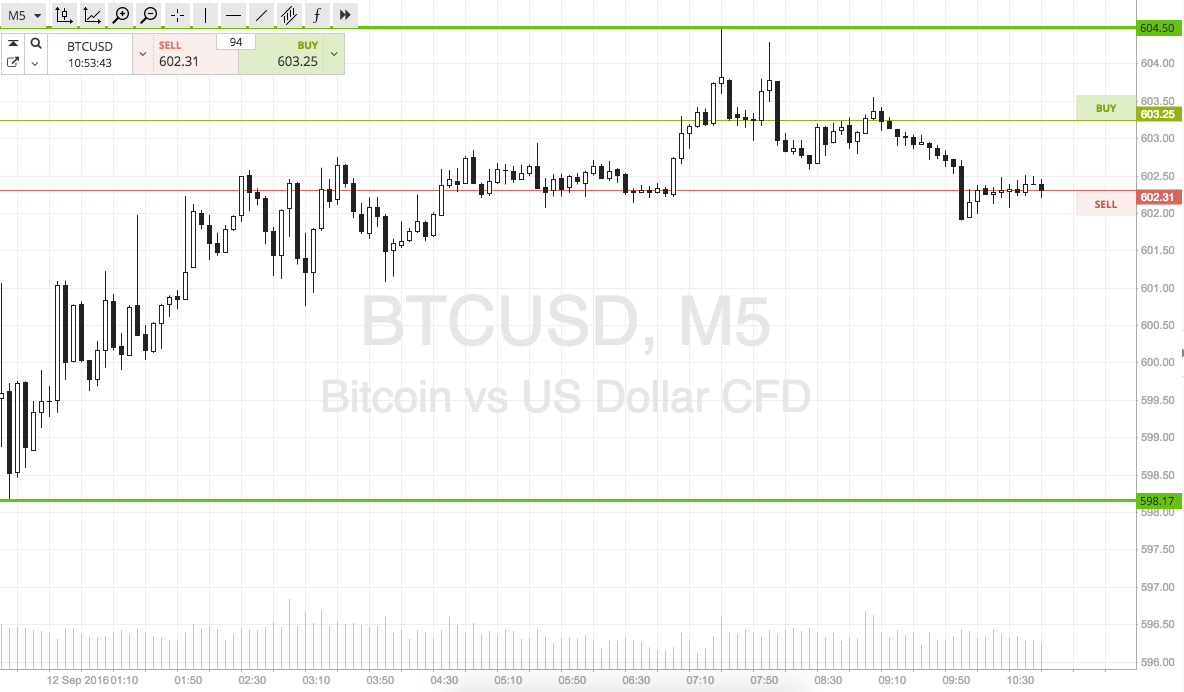

As the chart shows, we are looking at a range defined by in term support to the downside at 598 flat and in term resistance to the upside at 604.
The range is too tight to go at price with a intrarange approach, so we will be looking at things from a breakout perspective only today.
So, if price breaks above in term resistance, we will look to get in long towards an immediate upside target of 610 flat. Conversely, if price breaks below in term support, we will get in towards 590 flat. Stops just the other side of the entry levels define risk on the positions.
Charts courtesy of SimpleFX