

For this evening’s analysis, we’re going to go at our bitcoin price strategy a little different than normal. A look at the cart below reveals the formation of an upward sloping triangle during the European session, and this has offered up an opportunity to scalp the markets.
We can still define a range for the longer term breakout approach, but a few dollar scalp is always a nice quick turnaround position, so as we head into the close of the European session and move into the US afternoon, here’s what we are looking at.
The chart below, as mentioned above, highlights the triangle in question, and illustrates the action we’ve seen throughout the day today. Take a quick look before we get going.
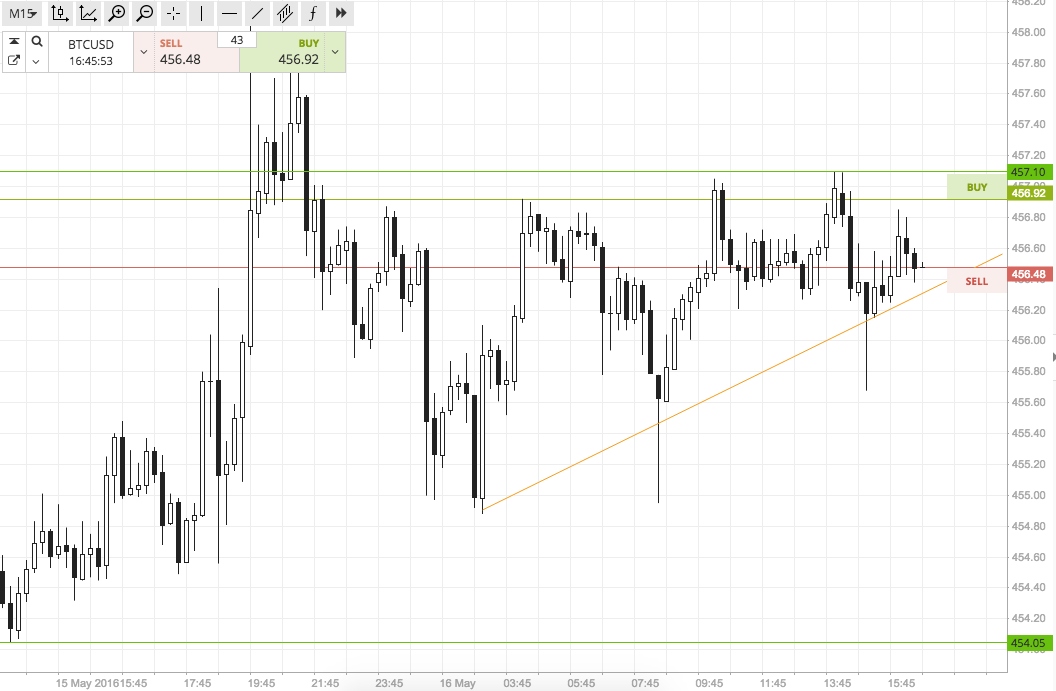

So, as the chart shows, the triangle rounds out just shy of where the bitcoin price is currently trading, and presents an immediate in term support at circa 456.5. In term resistance comes in at 457 flat, and forms the triangle’s upper boundary.
The way we trade these triangles is to wait for price to break through one of the aforementioned boundaries, and look to enter towards a target in line with the triangle’s height. Specifically, that is, if price breaks the upper channel resistance, we will look to enter towards an initial upside target of 461, based on the triangle’s base to peak height of around four dollars. A stop loss two dollars below entry gives the trade a nice two to one risk profile, and will ensure we are taken out of the position if price reverses.
Looking the other way, if price breaks to the downside through the upward sloping triangle channel, it will signal a short position towards the base at around 452.5. On this one, a stop loss somewhere in the region of 458 (if we enter circa 456.5) will keep our risk profile attractive.
Charts courtesy of SimpleFX
Header Image: NewsBTC