It’s Tuesday morning, and time to take the first of our twice daily looks at the bitcoin price. Yesterday we got chopped out on a false breakout, but overnight we managed to draw a small profit from the markets on a scalp trade on the short side. Today we are going to attempt to replicate our overnight success with a similar strategy. Specifically, outline a relatively tight range and look to get in on a short term scalp trade if price closes outside of the range, with a position in line with the direction of the break. Often we’ll witter on a bit here about previous action, but today, let’s get right down to it.
Take a look at the chart below before we get to the detail. It’s a five-minute candlestick chart that shows the last 24 hours of so worth of action, with the range in focus for today overlaid in green.
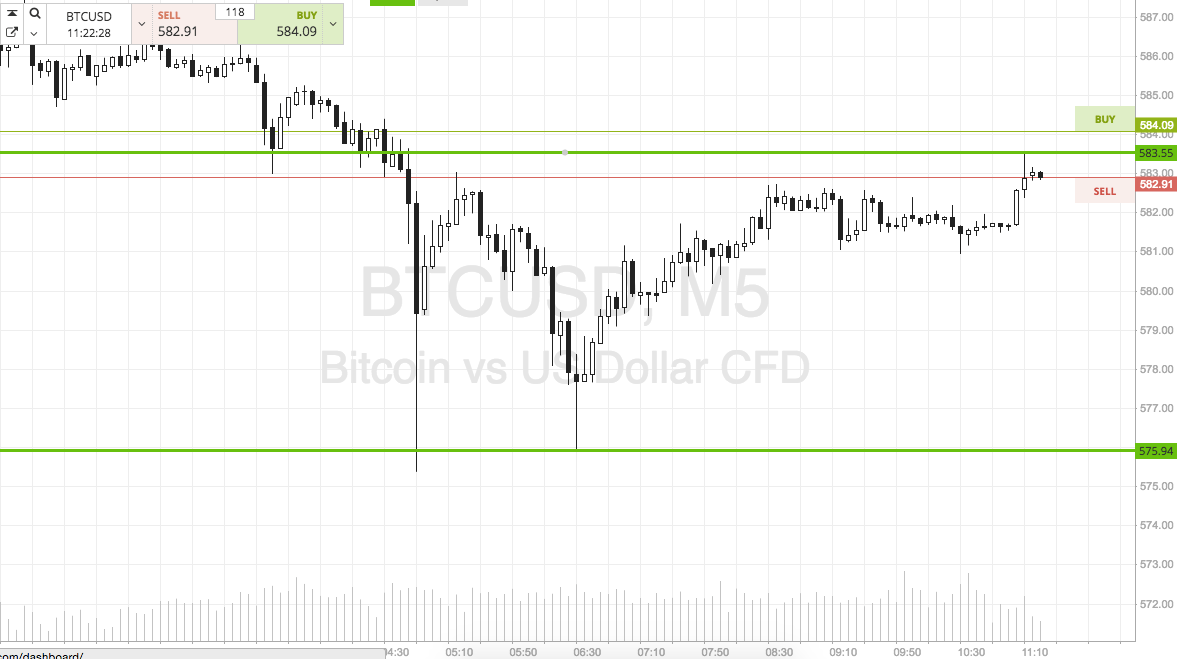

As the chart shows, the range in focus for today’s early morning European session in defined by in term support to the downside at 575 and in term resistance to the upside at 583. There’s just about enough room to go intrarange here, so while it’s not going to serve as our primary strategy for the day, if we get a bounce from support we will get in long with an upside target of resistance, and if we get a correction from resistance we will look to get in short with a downside target of support.
Looking at our primary strategy, if price closes above resistance we will enter a long position towards an immediate upside target of 590 flat. A stop on the trade somewhere in the region of 581 defines risk. Conversely, if we close below support we will enter short towards 565. A stop on this one at 578 looks good.
Happy Trading!
Charts courtesy of SimpleFX