Before we get going on this evening’s bitcoin price analysis, take a quick look at the chart below. It’s a fifteen-minute candlestick chart that shows the action seen in the bitcoin price over the weekend, and this morning, with today’s framework overlaid.
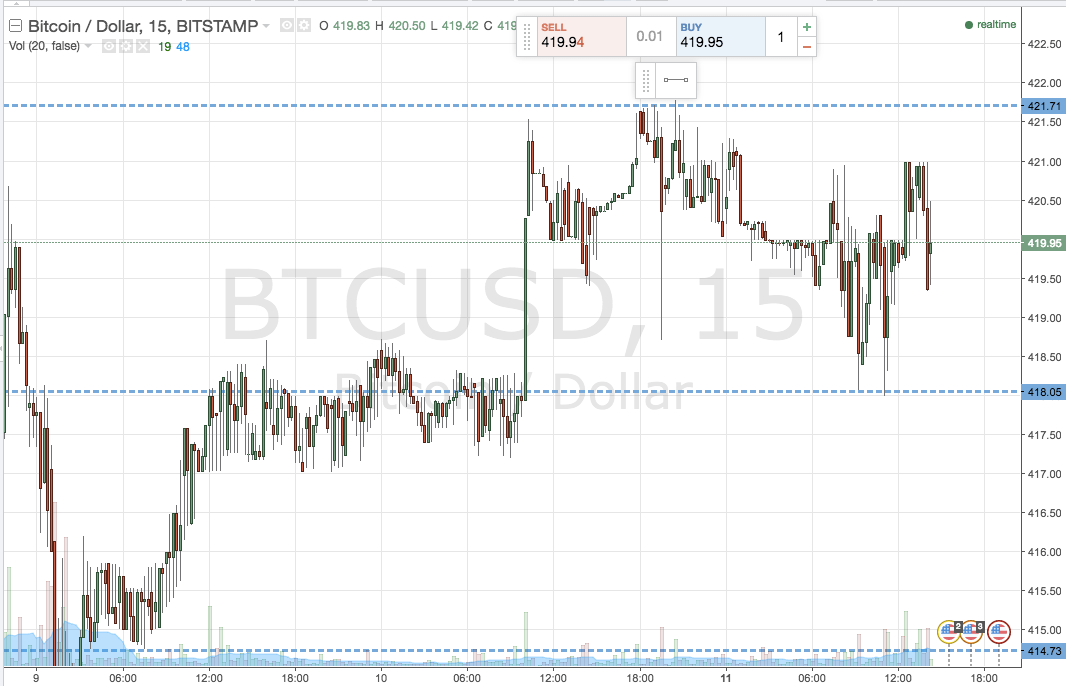

As the chart shows, the range we were looking at this morning was defined by in term support at 418 flat and in term resistance at 422. We went into the session with a breakout focus – that is, our range wasn’t wide enough to bring intrarange to the table. There’s a short term head and shoulders forming o the fifteen-minute chart, which suggests a medium term downside bias, but we remained short term neutral, looking for a bullish break to signal a long entry and a bearish one to signal a short trade.
As the chart shows, action throughout today’s session has been pretty weak. Volume is low, and after carving out fresh highs over the weekend, the bitcoin price has remained flat and well within our predefined range throughout the morning session on Monday.
So, with this said, how can we interpret today’s action into something tradable for this evening as the US afternoon completes and we head into Asia? Take a look at the second chart, below, to see what’s on.
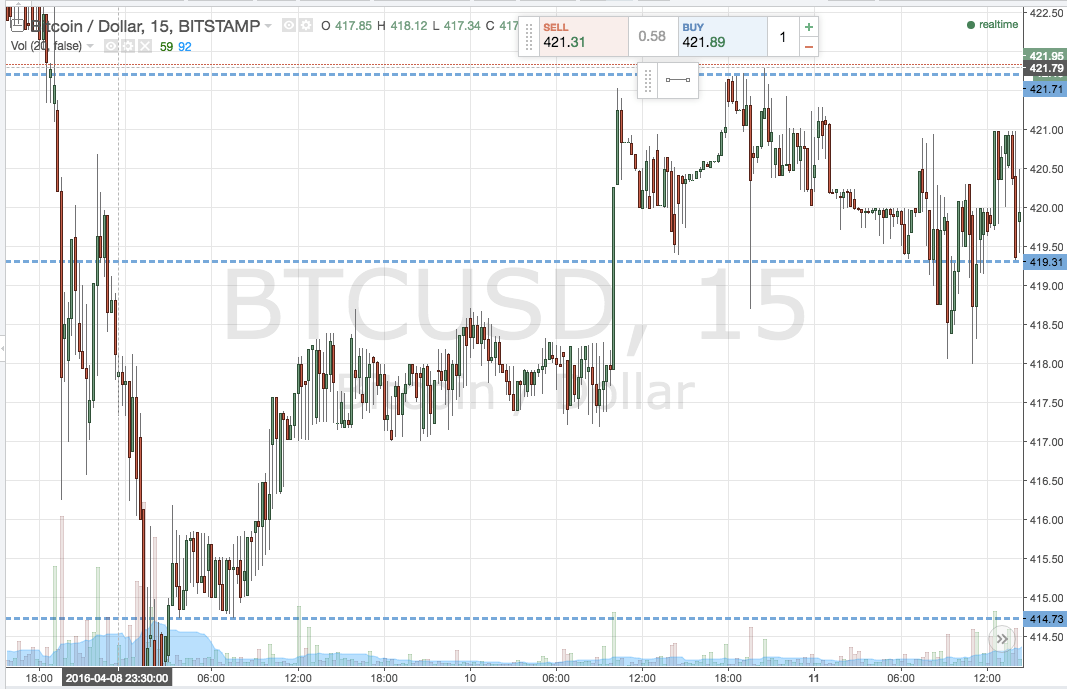

As the chart shows, we’re holding resistance firmly in place at 422 flat. We’re going to tighten things up a bit, however, and bring support to 419.3.
With this newly tightened range, we’re going to take a scalp breakout approach – long on a break above resistance towards a tight target, and the reverse for an equally tight target to the downside on a close below support. Specifically, a target of 425 on the long side and 415 short. Stops just the other side of the entry define the risk on the trades, and limit our potential loss if things turn around.
Charts courtesy of Trading View