So there we go then, another day done in the bitcoin price, and with its completion, another week out of the way. If you’d have asked us yesterday where we thought price was heading for the weekly close, we’d have been a little restrictive in our estimates. Action was trading sideways, and there didn’t look to be really that much potential for any serious momentum.
Fast forward to this morning’s session, of course, and all that changed. Price started to run overnight, and we kicked off the Friday European trading session in and around the 1200 mark – a level we’ve been watching for some time, and one that the breaking of which would give us a nice (and favorable) longer term bullish bias.
So, as we head into the US evening session this evening, and close out the week properly, what has price action today told us about what we might expect over the weekend, and where can we use this action in terms of setting up a range with which to take advantage of any volatility?
Let’s take a look.
As ever, get a look at the chart below before we get started so as to get familiar with the range we’re using going forward. It’s a five-minute candlestick chart, and it’s got our key range overlaid in green.
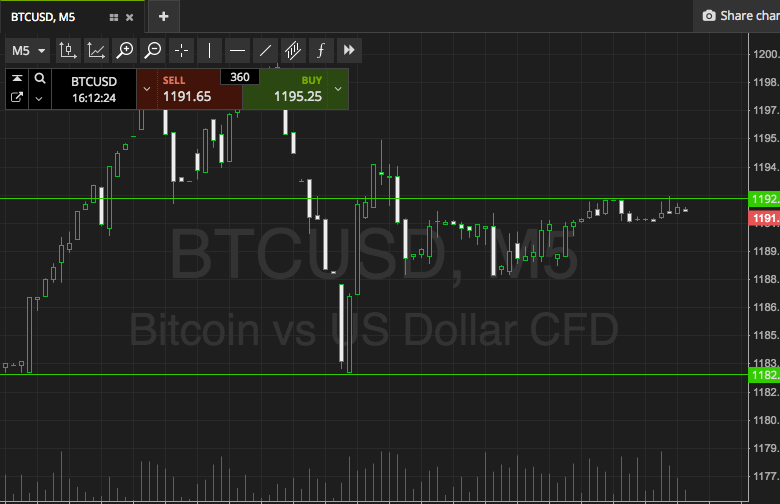

As the chart shows, the range we are taking into tonight’s session is defined by support to the downside at 1182, and resistance to the upside at 1192. It’s shifted down from this morning’s range, so we’ll have to alter our targets a little to adopt this shift.
If we get a break above resistance, we’ll be in long towards 1200 flat. Conversely, a close below support will get us in short towards a downside target of 1170.
Let’s see what happens.
Charts courtesy of SimpleFX