If you read our coverage this morning, and indeed, if you’ve caught any of our bitcoin price watch pieces this week, you’ll be more than familiar with out 1100-1200 key level hypothesis. If you’re new to this week’s efforts, then first, welcome, and second, we’re basically using these two levels as bell weathers for a long (or at least medium) term bias in the bitcoin price. If we see a break of 1200 before a break of 1100, we’re long term bullish. If the reverse happens, and we see a break of 1100 before a break of 1200, then the opposite is true.
For us, of course, being in this industry and having bitcoin holdings (the value of which is of course tied to long term price), a bullish bias is preferred. From a short term perspective, however, and from the perspective of those that just trade this stuff, and don’t hold any substantial degree of their portfolio in bitcoin, then it doesn’t really matter which way price moves.
For the purposes of this discussion, we’re going to pretend we’re in this latter camp.
So, take a look at the chart below to get an idea of what’s on this evening in the bitcoin price. It’s a five-minute candlestick chart, and it’s got our key range overlaid in green.
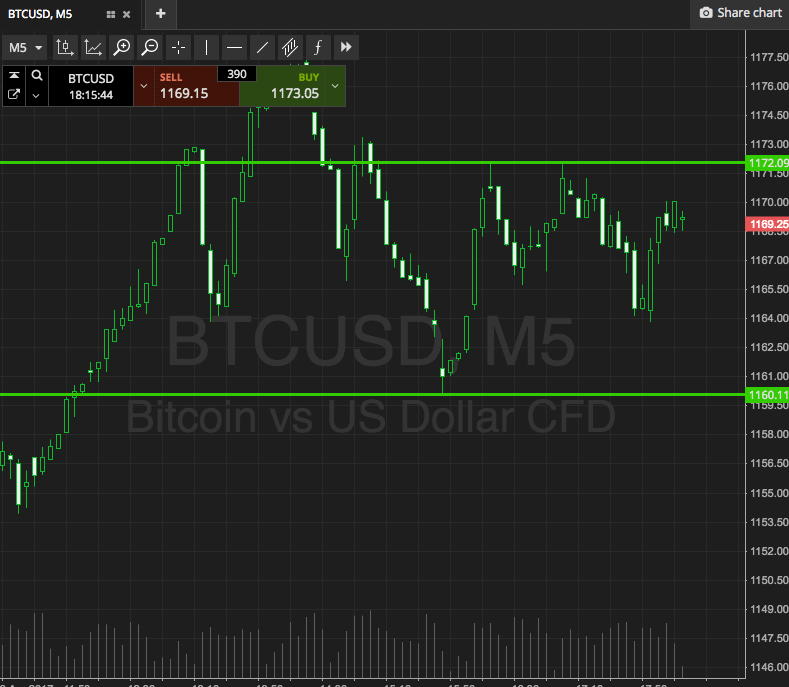

As the chart shows, the range we’ve got set up for this evening is defined to the downside by support at 1160, and resistance to the upside at 1172. We’re just going to keep things real simple for tonight, with a breakout strategy focus only, and nice tight stops and targets.
Specifically, a close above resistance will get us in long towards 1185 and we’ll stop out of the trade at 1168. Conversely, a close below support will get us in short towards 1150, and a stop at 1153 will define risk.
Charts courtesy of SimpleFX