In this morning’s bitcoin price watch analysis, our primary focus was the forming of a triangle, a classical charting pattern, and the implications of this triangle from our strategy throughout the day. We hoped that we would see price break out of the triangle in a definitive direction and – in turn – that we would see a sustained move in one direction or the other. As things turned out, we didn’t really get anything decisive. When we published the first analysis, price was just about to break through the triangle’s point – the point at which we should have seen the most convergence. However, instead of breaking up or down, price just traded sideways, ambled out of the triangle point and has been pretty much flat ever since. This means we didn’t get into any trades during today’s European session, and we remain flat on the markets at time of writing. So, with this in mind, and as we head into the Asian session tonight, what are we looking at from an intraday perspective? Let’s have a look.
Before we get started, take a quick look at the chart below to get an idea of the levels in focus for the session.
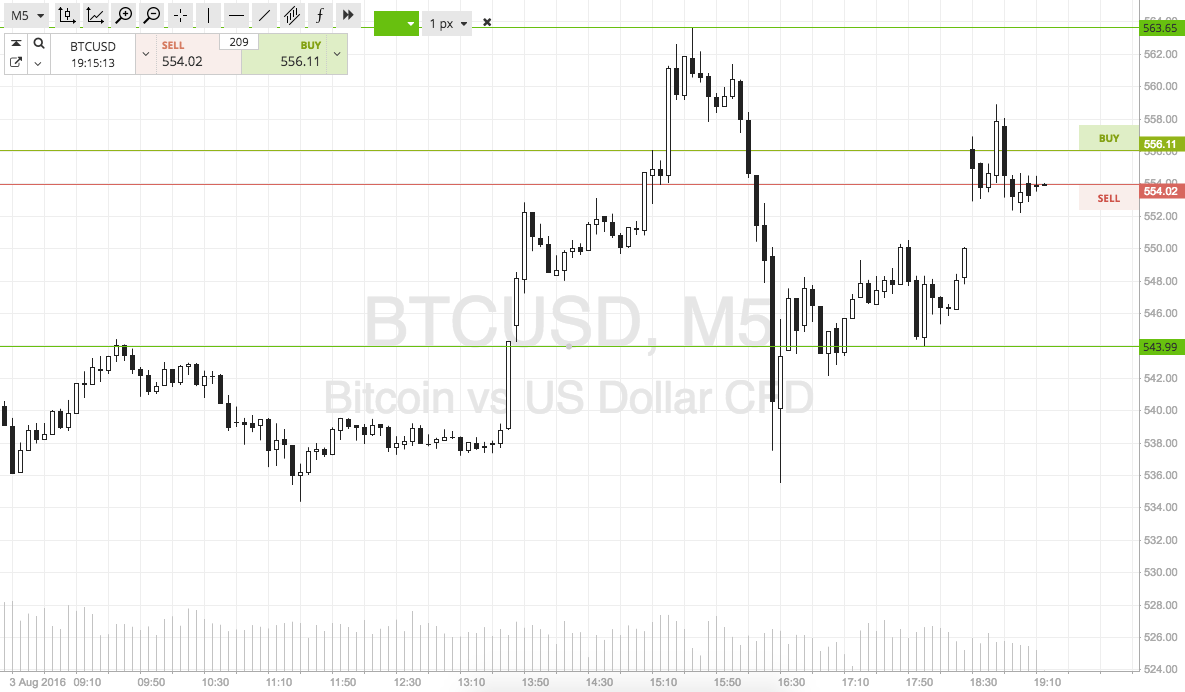

As the chart shows, the levels that we are focusing on are in term support to the downside at 534, and in term support to the upside at 563.
It’s about a thirty-dollar range, so there’s plenty of room for us to go at price with an intrarange strategy. Long at support, short at resistance, target the opposing levels and use a stop just the other side of the entry to ensure we are taken out of the trade in the event of a bias reversal.
On the breakout trades, a close above or below resistance or support respectively signals long and short in the direction of the trade, $15 target, $5 stop.
Charts courtesy of SimpleFX