The Friday session is over out of Europe, and things are now pretty much shut down for the weekend. The US markets are out on an early finish, and Asia is well into Friday night by now. This means we’re probably not going to have too much luck with our intraday strategy this evening, but we’re going to set up against price anyway, just to see what happens.
So, and avoiding the usual ramble that comes in this section of the analysis, we’re going to get straight to the point. Take a look at the chart below to get an idea of our key levels, and to see what happened during today’s European session. As ever, it’s a five-minute candlestick chart with a little over twelve hours’ worth of action displayed, and it’s got our range overlaid.
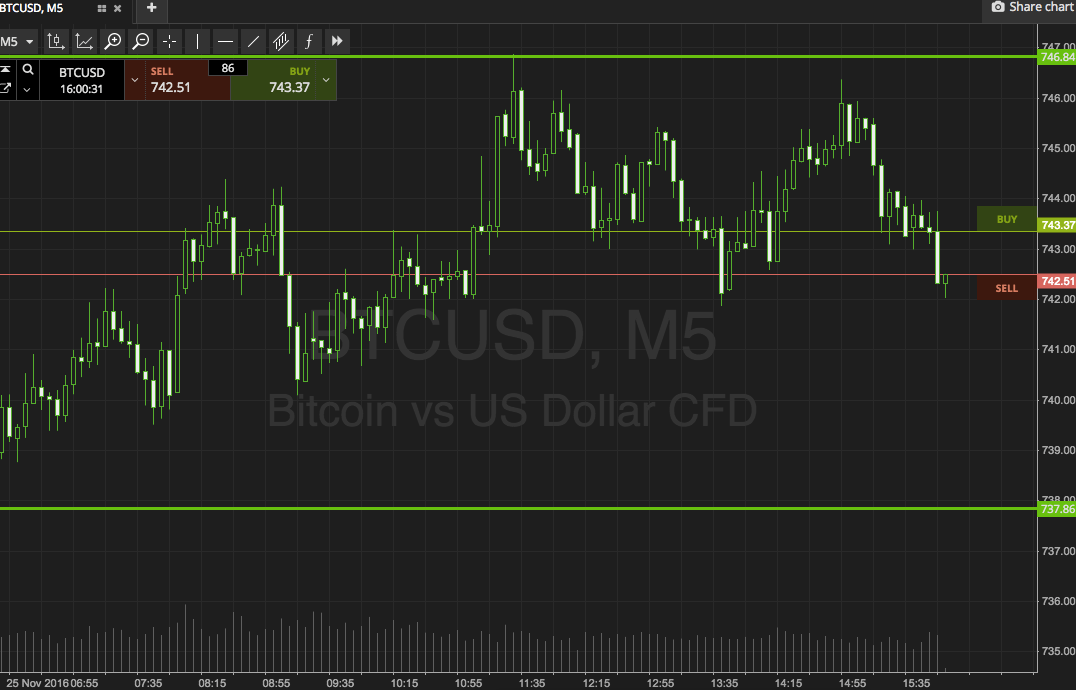

As the chart shows, the range we are focusing on for the session is defined by in term support to the downside at 737 and in term resistance to the upside at 746. We’ve got plenty of room here, so intrarange is on for the time being. Specifically, if we see a bounce from support, we’ll look to get in towards resistance as an immediate upside target. Conversely, a correction from resistance will put us short towards support. On the first trade, a stop just below support, and on the second, a stop just above resistance.
Now to our breakout approach.
If price breaks above in term resistance, we will wait for the candlestick close before getting in long towards an immediate upside target of 754. A stop on this one somewhere in the region of 743 kills off any downside risk. Looking south, a close below support gets us in short towards 730. Again we need a stop, and we’re looking somewhere in the region of 741 to define the position.
Happy Trading!
Charts courtesy of SimpleFX