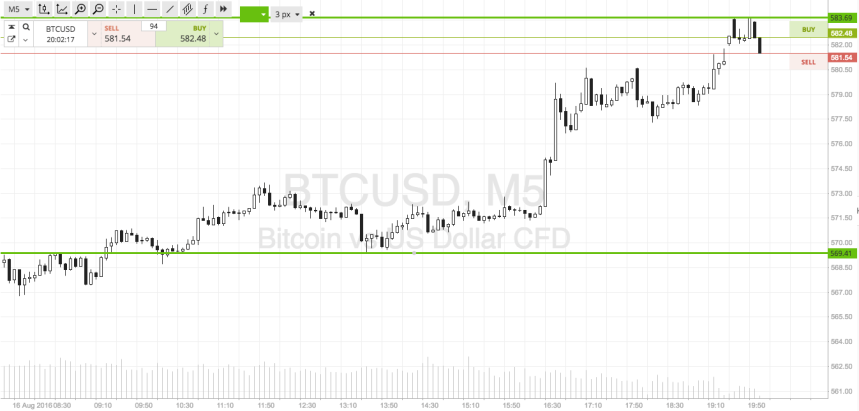
The markets have just about drawn to a close now out of Europe, and once again we had a pretty active day in the bitcoin price. Action from this morning has generally been to the upside, although we did have something of a correction from resistance a little earlier on. This got us into a short term intrarange trade, but we’ve since been taken out the trade for stop loss hit. Price is now trading just shy of intraday highs, and we’re going to adjust our range heading into this evening to accommodate. As ever, take a quick look at the chart below to get an idea of the levels where focusing on. Given today’s action, we are widening things out little bit, in the hope that we can go for a slightly more aggressive target if we get a break, as opposed to the standard scalp trades we have been looking at to date. The chart below is a five-minute candlestick chart showing the last 12 hours or so worth of action, and it’s got our fresh range overlaid in green.
So, as the chart shows, for this evening as we head into the US session and beyond into Asia, we are going to look at support to the downside at 569 and resistance to the upside at 583. There is plenty of room for intrarange action on this one, so long at support and short at resistance, targeting the opposing levels with a stop loss just the other side of the entry to define risk on the respective positions. Looking at breakout entries, if price closes above resistance we will get into a long trade towards an immediate upside target at 595. A stop loss on this one at 580 keeps risk tight. Conversely, a close below support will signal short towards 560 flat, with a stop loss at 571 keeping risk tight.
Charts courtesy of SimpleFX
