In this morning’s bitcoin price analysis, we noted that a triangle had formed mid range in our predefined parameters, and that we would look at using this triangle to enter long towards an upside target of 422 flat if – and when – it completed. We classed completion as the breaking of the triangle’s upper channel (also serving as in term resistance) and a subsequent close above this level. However, we also noted that we were already in a trade on the back of last night’s action, and that we would wait until this trade completed (i.e. a stop loss taken out or a target hit) before entering a fresh position. Things have now matured throughout the European morning, and we are about to head into both the UK close and the mid session break in the US.
With this said, what did action in the bitcoin price tell us about what we can expect this evening, and how did our trade and analysis perform today so far? Let’s take a look. First things first, the chart below shows what went on during this morning’s session, and highlights the key levels we are focusing on for this evening’s trading in the bitcoin price.
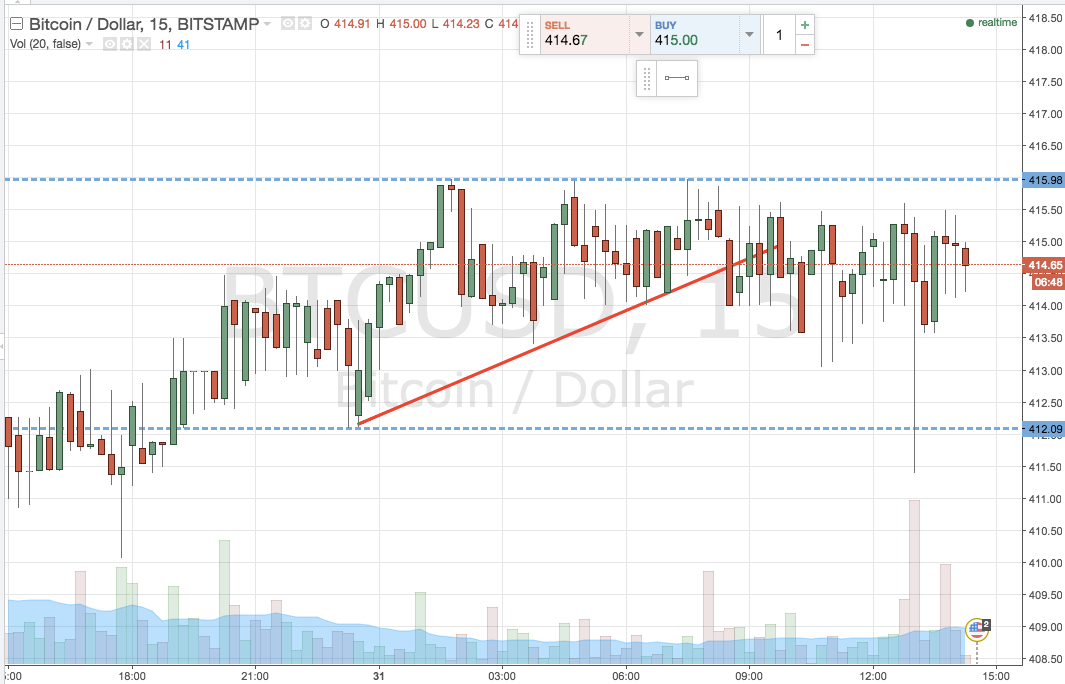

So, as the chart shows, we didn’t get the action we’d hoped for, and price broke through the lower channel of our triangle pattern shortly after the publication of our analysis. A spike down also served to take out the stop loss on our previous trade for a small loss.
We remain within range, however, and so the levels we are looking at tonight mirror those we highlighted this morning: in term support at 412 flat and in term resistance at 416 flat.
Sticking with our upside target, a close above resistance will signal long towards 422, while a close below support will put us in a short entry towards 407.
A stop on both trades just the other side of the levels in question will define our downside risk on the positions.
Charts courtesy of Trading View