We’re heading into the middle of the week, and action so far has given us plenty to go at. Having traded relatively flat over the weekend, the bitcoin price entered the week with a bang, rushing through the 550 flat mark and sustaining some upside momentum towards what now looks to be the next major upside milestone – 600 flat. Whether we will actually break this level remains to be seen – longer term its almost an inevitability, but near term we cannot be so sure.
Regardless, we are going to set up against short term action as we do every day – that is, through a predefined range and a breakout signal approach. Our range today (as we’ll get to shortly) is plenty wide enough for an intrarange approach as well, so that will be our secondary strategy going forward.
So, with this said, here’s a look at what’s on today, and where we are looking to get in and out of the market as and we we get some level of volatility, be that to the up or the downside during today’s European morning session. Here goes.
As ever, get a quick look at the chart below before we get into the nitty gritty to get an idea of the level we are looking at.
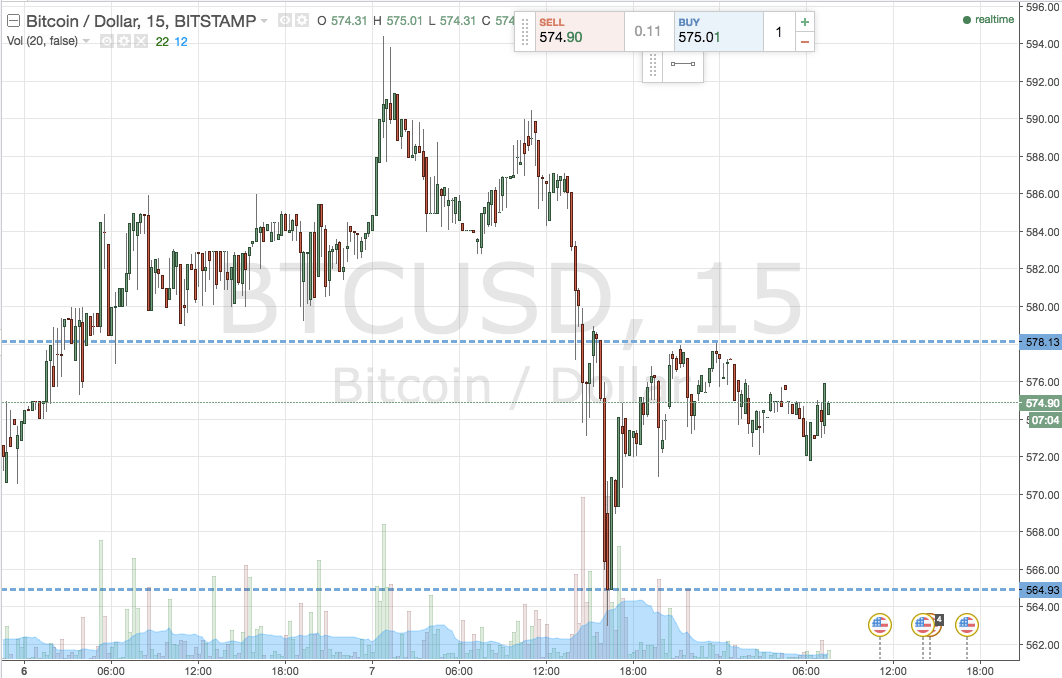

As the chart shows, today’s range is defined by in term support at 564, and in term resistance at 578. As we mentioned above this circa $14 range is plenty to go at intrarange, so long at support and short at resistance (assuming price fails to break through either) with a stop just the other side of the entry to define risk.
Looking at breakout, if price closes above resistance we will look to enter long towards 588 flat. Short on a close below support with a target of 555. Both trades are pretty aggressive, giving us plenty of room for stop losses.
Charts courtesy of Trading View