

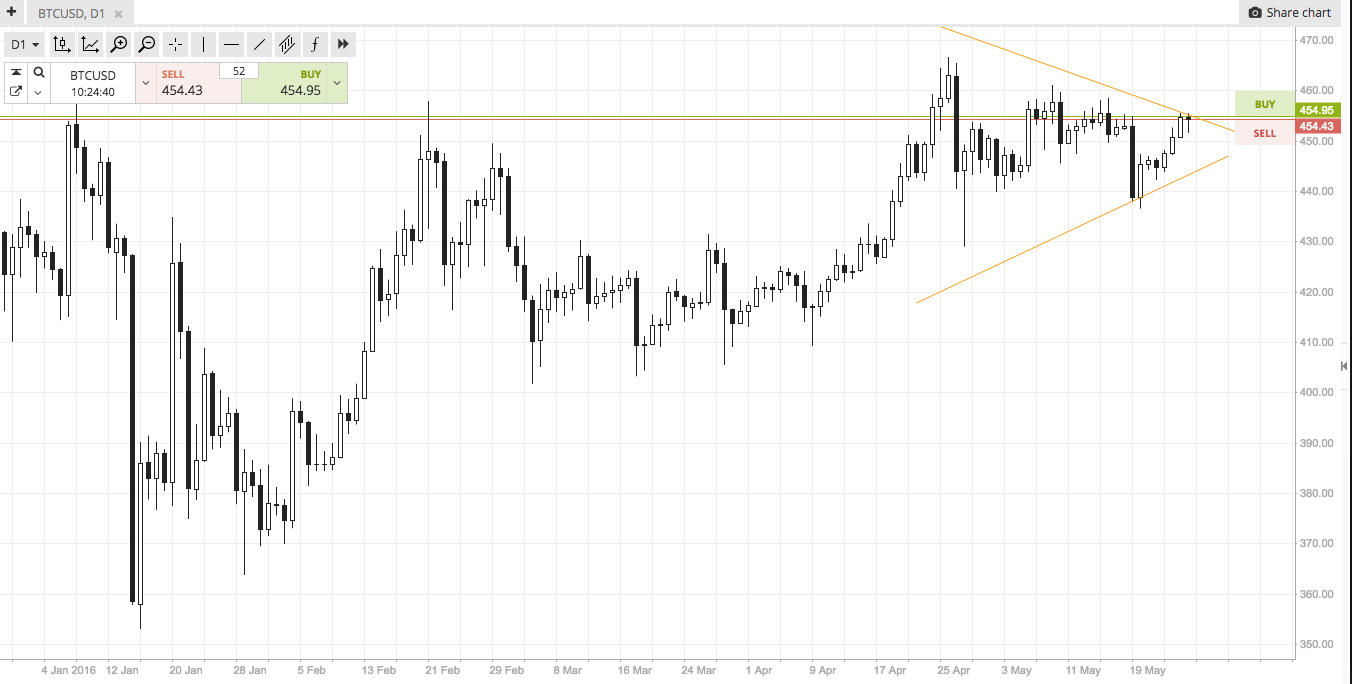
We are going to start off this morning’s analysis with a daily chart. It’s little more expansive a time frame than we normally focus on, but it offers us some insight, so it’s worth looking at quickly. As the chart below shows, action in the bitcoin price has, over the last few weeks, formed something of a triangle at the end of an upside run. We are going to use this triangle to help form our bias today – specifically, a break of the triangle’s outer perimeters (in either direction) will dictate our medium to long-term bias in the bitcoin price.

For our intraday strategy, however and as we head into a fresh European session this morning, let’s look at a more focused timeframe. The chart below shows the same action, but on a 15-minute candlestick chart, and only showing the last 24 hours or so of price action rather than the last few weeks’ worth.
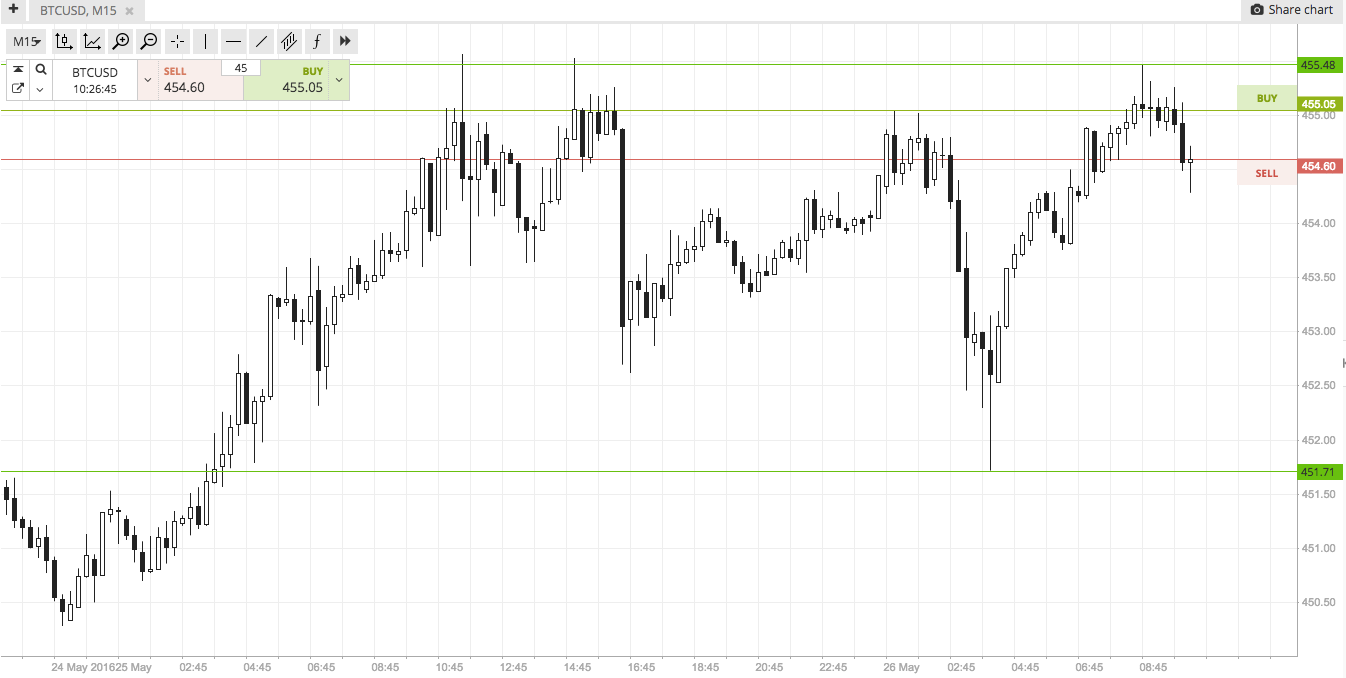

As you see from the chart, action has been pretty up and down over the last couple of days, but it has given us some well-defined levels to focus on. Specifically, these are in term support at 451.71 and resistance to the upside at 455.48. Price is currently trading just shy of the latter of these two levels, and so we will look at a potential upside break first. If price closes above resistance it will signal a long entry towards an initial upside target of 464. A stop loss on this one somewhere in the region of 453.5 will keep things tight to the downside from a risk management perspective.
Looking the other way, if price runs down toward support, and breaks (and closes) below this level, we will look to enter short towards a medium-term downside target of 445. Again we need a stop loss, and somewhere in the region of 453 looks good.
Happy Trading!
Charts courtesy of SimpleFX
Image courtesy of NewsBTC