It has been a pretty interesting week so far in the bitcoin price. Having carved out fresh highs over the weekend, price has spent the first three days of this week in decline, and overnight, reached fresh lows just ahead of 534, before correcting into today’s European open. We are about to enter a fresh European session this morning, and as we head into the day, what are the levels that we’re focusing on from our bitcoin price strategy perspective, and where will we look to get in and out of the markets on any volatility during the day? As ever, take a quick look at the chart below to get an idea of the levels on which we are focusing. It is a 15-minute candlestick chart, with a timeframe of around the last 24 hours’ worth of action. It doesn’t show the large gains over the weekend, but it does show the tail end of the decline as well as action seen across the tail end of yesterday’s session and overnight out of Asia.
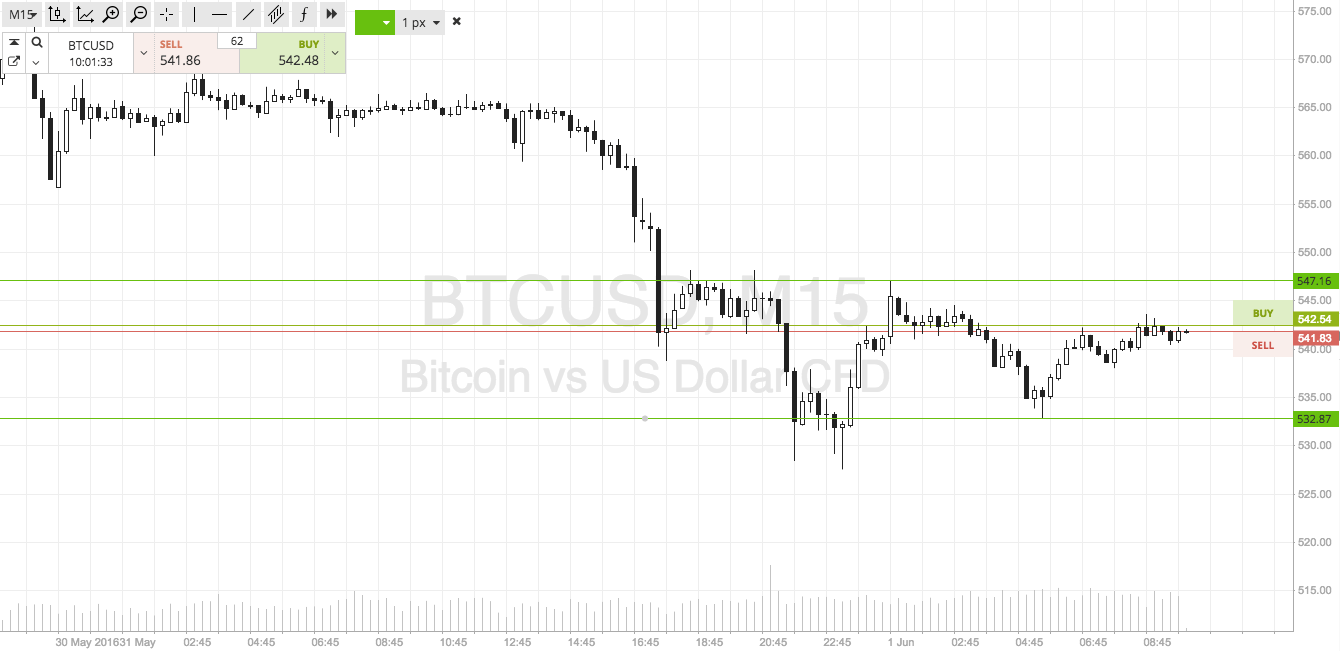

For the past couple of days, and in response to the sideways action seen across the sessions, we have traded a relatively tight range. Today, we are going to widen out this range and go for an intrarange strategy on the volatility we see during the session. Specifically, we’re looking at in term support at 532 to the downside, and resistance at 547 to the upside. If we see a bounce from support, we will enter long towards an initial upside target of resistance. A stop loss on the trade somewhere in the region of 529 defines our risk and limits the potential downside on the position if price reverses.
Looking the other way, if price correct from resistance, it will signal a short entry towards support. Again we need a stop loss, and somewhere in the region of 550 looks good.
Charts courtesy of SimpleFX