We’re now closing in on the end of the session out of Europe, and thing have settled down a little bit in the bitcoin price. Over the weekend, and throughout the early session, we saw a bit of up and down action as what looked like market rebalancing took place. We managed to jump in and out of the markets a couple of times, and this has led to a few quick profits, but nothing really in the way of sustained action, and we’re currently watching price trade sideways as part of what seems to be a consolidation phase.
So what’s next?
Well, it’s tough to say. Last week, we got a couple of these consolidation phases, and each time they broke out, they did so to the upside. This gives us something of a temporary bullish bias, but temporary is all we can really allow ourselves right now.
If we get a downside break, we’re going to be watching the 1300 flat level on the wider timeframe charts as indicative of longer term bias.
But what about the shorter term outlook?
Take a look at the chart below to get an idea of what’s on, and where price is trading right now. It’s a five-minute candlestick chart and it’s got our key range overlaid in green.
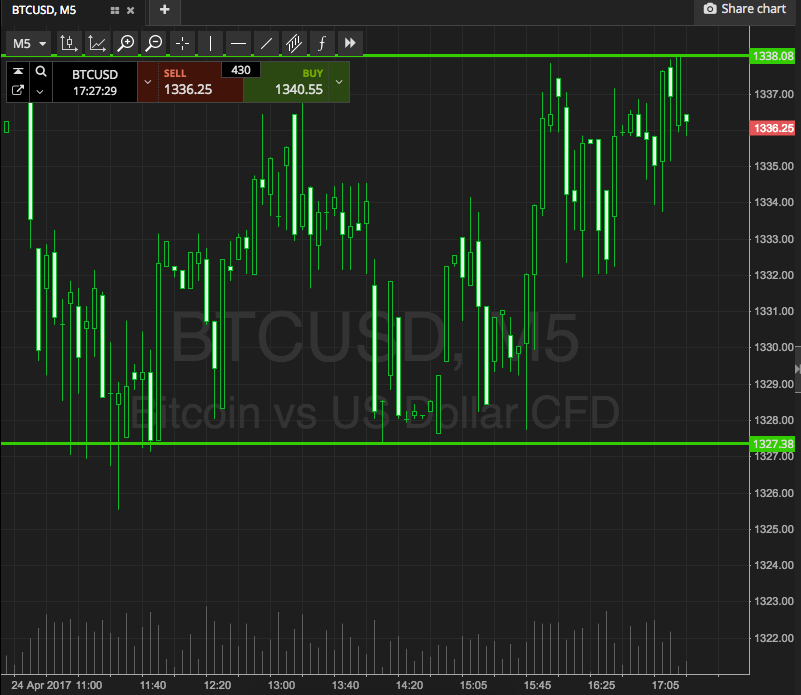

As the chart shows, the range we’re looking at tonight is defined by support to the downside at 1327 and resistance to the upside at 1338. It’s wide enough (just about) for an intrarange strategy, but we’re going to stick with breakout for now.
So, if we see price close above resistance, we’ll be looking at getting in long towards an upside target of 1350. Conversely, a close below support will put us in short towards 1320 flat.
Stops just the other side of the entries on both trades will take us out of the trade in the event of price reversing against our bias.
Charts courtesy of SimpleFX