There’s another day gone, and the time has come to take a look at the bitcoin price for the second time, and see if we can’t take advantage of any volatility this evening. As we noted this morning, things seem to be getting better and better from pretty much all angles – volume is up, price is up, volatility is up – and this makes for far more interesting trading of the intraday charts than when action is weak and flat.
Today’s action wasn’t exactly game changing – we didn’t manage to get into positions as we might have liked – but volume remains pretty solid, and we expect to see some momentum on the intraday charts going forward. With any luck, we’ll be able to get in ahead of said momentum, and pull a profit fro the market.
So, with this in mind, and as we move into the US session this afternoon and – beyond that – into the Asian session, let’s try and put some focus levels on the table and see where they take us. As ever, the chart below outlines our baseline framework moving forward.
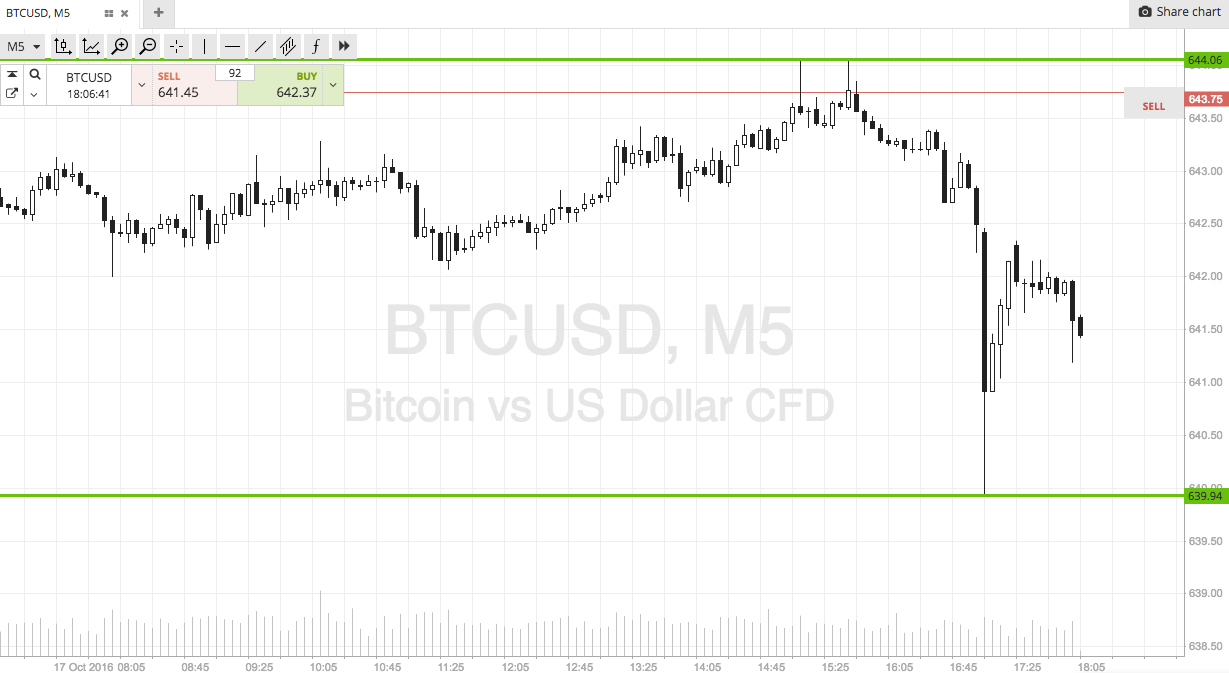

As the chart shows, we are looking at a pretty tight range, as defined by in term support to the downside at 640, and in term resistance to the upside at 644 flat. Breakout scalps are our target for today, so let’s shelve intrarange for the time being.
We are looking for a close above in term resistance to validate an immediate upside entry towards a target of 650 flat. This one’s a pretty simple trade – long on the close with a stop at 642 to define risk.
Looking short, if we see price close below resistance, we are going to get in short towards an immediate downside target of 632.
A stop on this one somewhere in the region of 643 works well.
Happy Trading!
Charts courtesy of SimpleFX