Action today has been pretty flat, and we’ve not had too much opportunity to get in and out of the markets according to the levels we outlined this morning. Price ranged sideways for the majority of the European session, and while we got the odd break, it didn’t last, and price returned to close back within the range before the candle closed out, so we didn’t get in on the break.
It can be frustrating sometimes when we don’t get in on the breaks, especially when we see volume, but there’s a silver lining. When price ranges sideways on reasonable volume we generally get some pretty solid key levels outlined. Specifically, because price tests support and resistance repeatedly, the levels under scrutiny become stronger. Strong levels generally translate to strong breaks, and strong breaks carry forward to attractive price targets.
So, with this in mind, let’s get things outlined for this evening’s session. As ever, get a quick look at the chart below to get an idea of what’s on for the Asian session going forward. It’s a five-minute candlestick chart with a really tight range overlaid in green. We are going for a tight range in the hope that we get some pretty frequent breaks.
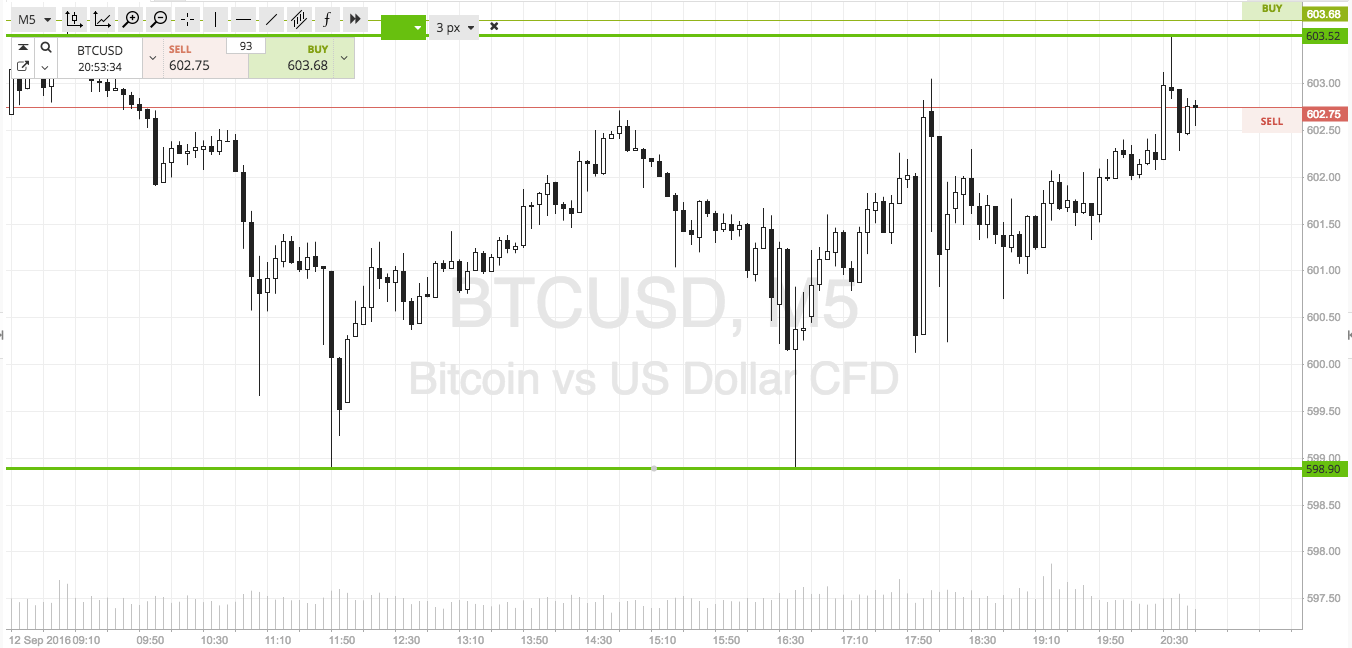

So, as the chart shows, we are looking at support to the downside at 598 flat, and resistance to the upside at 604. We’ve mentioned it’s a tight range, and this means we won’t be going after price intrarange; instead we’ll be focusing on breakout near term.
If price closes above resistance, we will look to get in long towards an immediate upside target of 610 flat. A stop on the trade at 600 looks good.
Looking south, if price closes below support, we will get in short towards 590 flat. A stop on this one at 601 works well.
Charts courtesy of SimpleFX