So that’s the end of another day in the bitcoin price, and it’s time to take a look at what happened today and what we are going for this evening. As we mentioned this morning, things were pretty flat overnight, and we were hoping that we might see some volatility during today’s US session on the back of financial asset market volume increase created by the presidential debate last night.
Things haven’t quite turned out as we hoped, and we didn’t manage to get into any scallop positions on action out of Europe, but we’ve some decent levels to work with, so we’ll take that in to consideration heading forward.
So with that in mind, let’s take a look at what’s going on.
The chart below is a five-minute representation of the last twelve hours’ worth of action. Take a look at the before we get started on the detail.
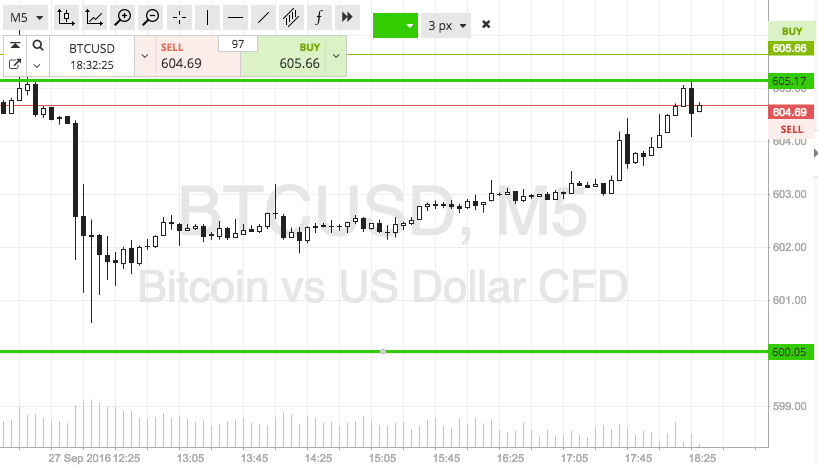

As the chart shows, the levels in focus for today are in term support to the downside at 600 flat (we could have used the probably more appropriate 601 here, but 600 is psychologically relevant, so we’ll go for that instead) and in term resistance to the upside at 605 flat.
The range here is probably just about wide enough to go at price with an intrarange strategy (tight, but just about) so long at support and short at resistance, stops just the other side of entry and a target of the opposing level.
Looking at our primary strategy, however, we’re targeting breakout scalps.
If price breaks through resistance to the upside, we will get in long towards an immediate upside target of 610. Conversely, if price closes below support, we are going to get in short towards 593 to the downside. Again, we need a stop on these, and again just the other side of the entries (say, one or two dollars) will do nicely.
Happy trading!
Charts courtesy of SimpleFX