When we conducted the first of our two bitcoin price watch piece analyses this morning, we went into markets with something of a bullish bias. Action has now matured throughout the European session on Wednesday, and this bias looks to have been a bit premature. Price has declined throughout the day, without breaking either of our key levels, and we haven’t managed to get into any substantial trades as yet. This isn’t a bad thing, it just means we have to be a little bit patient going forward. So, as we head into tonight’s Asian session, let’s take a look at what we’re focusing on as far as our intrarange strategy is concerned. The chart below shows our latest range, overlaid on about 12 hours’ worth of action on a five-minute candlestick chart.
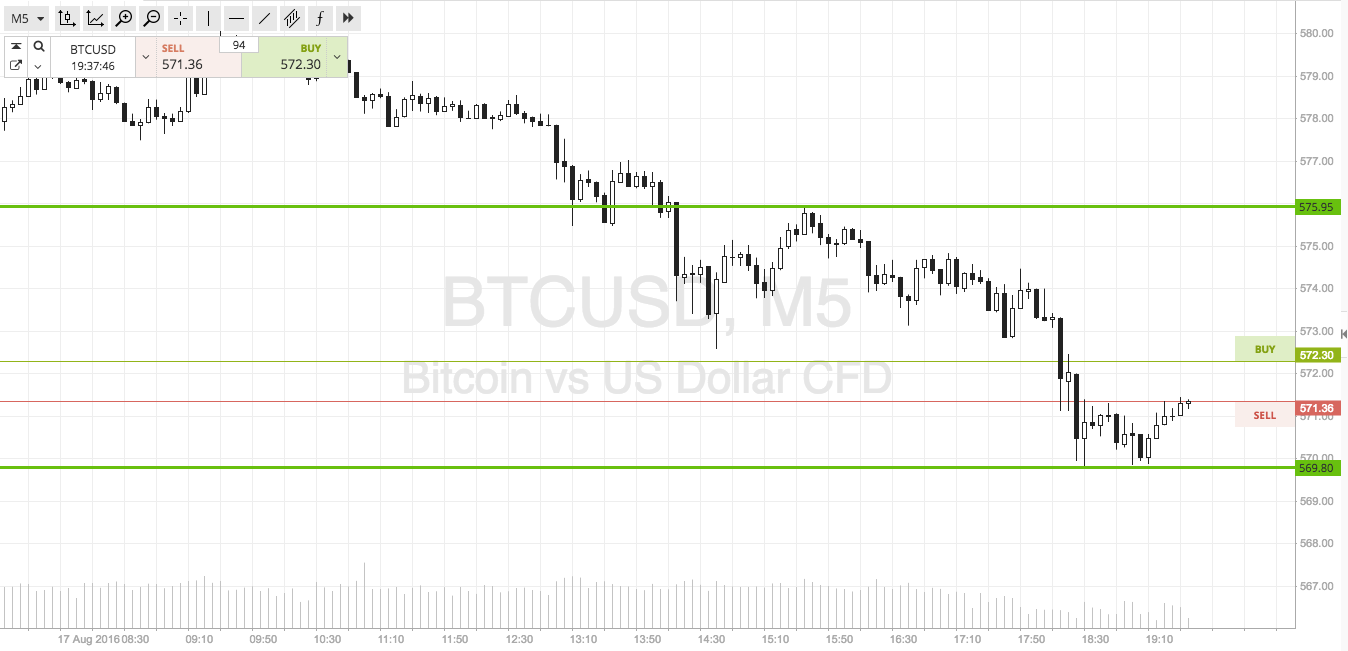

As the chart shows, the range in focus for this evening is defined by 569 as support to the downside, and 576 as resistance to the upside. There isn’t really enough room to go at things with an intrarange strategy on this width of range, purely because our bid ask spread will make it impossible for us to effectively implement any sound risk management principles. If we get a breakout a little bit later on, however, we can look to widen out our range in response to the breakout, and then maybe we will have a look at implementing intrarange as well as breakout style. For now, though, we are going to stick with breakout scalp.
If price closes below support at 569, we will look to enter a short position towards an immediate downside target of 560. On this one, a stop loss somewhere in the region of current levels – 571 – looks good. Looking long, a close above 576 signals a bullish position towards 582. Again we need a stop loss, and somewhere in the region of 573.5 looks like it should do the trick.
Charts courtesy of SimpleFX