It is Friday morning and we are about to get things moving for the final session of the week in the bitcoin price. Exactly what’s going to happen today is very much up in the air. Things really took off during the late session on Thursday but, subsequent to the run, seemed to take a bit of a step back and we saw price correct back down towards current levels in and around 14,800.
Whether this correction has bottomed out remains to be seen but all we can do is make sure that, whatever happens next, we have the levels in place that can take advantage of it.
So, with all that said, let’s get our strategy outlined for today and see what we can do as far as drawing a profit from the market is concerned.
As ever, take a quick look at the chart below before we get started so as to get an idea where things stand and where we are looking to jump in and out of the markets according to the rules of our intraday strategy.
The chart is a one-minute candlestick chart and it has our range overlaid in green.
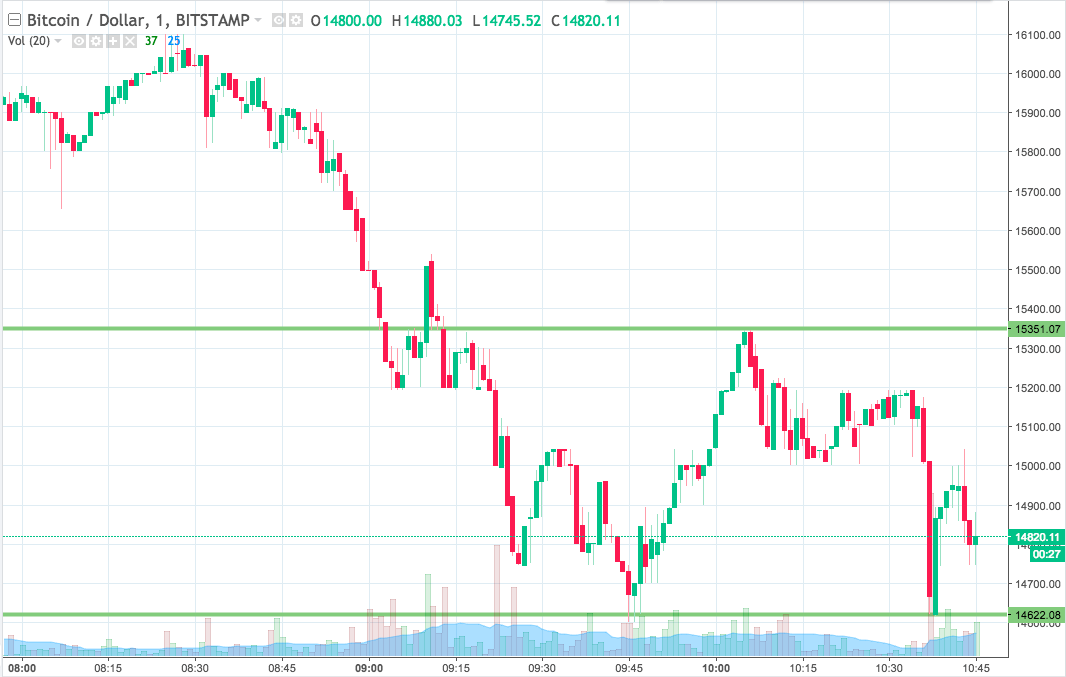

As the chart shows, the range we are looking at for the session today comes in as defined by support to the downside at 14622 and resistance to the upside at 15351.
That’s a pretty wide range and normally would be enough to trade intrarange but, for today at least, we are going to stick to breakout, purely based on the action we have seen over the last 24 hours.
So, if we see price break above resistance, we will enter long towards an immediate upside target of 15400.
Conversely, a close below support will have us in short towards a downside target of 14550.
Let’s see how things play out.
Charts courtesy of Trading View