We are heading into the close of today’s trading out of Europe in the bitcoin price and we have had a pretty volatile day so far. Things started off relatively quiet, and we got the period of consolidation that we were looking for and that we outlined in this morning’s analysis is likely to take place before any major breakouts happened. Pretty quickly, however, things started moving and we managed to jump in and out of the markets according to the rules of our breakout strategy on a number of occasions for a pretty clean and tidy profit.
We are now around about the crossover period between the European and US sessions – a period that is known for considerable volatility – and so let’s get some levels put together that we can try and use as we head into the session this evening in an attempt to replicate our success during today’s trading. As ever, take a quick look at the chart below before we get started so as to get an idea where things stand and where we are looking to jump in and out during the session going forward. It is a one-minute candlestick chart and it has our range overlaid in green.
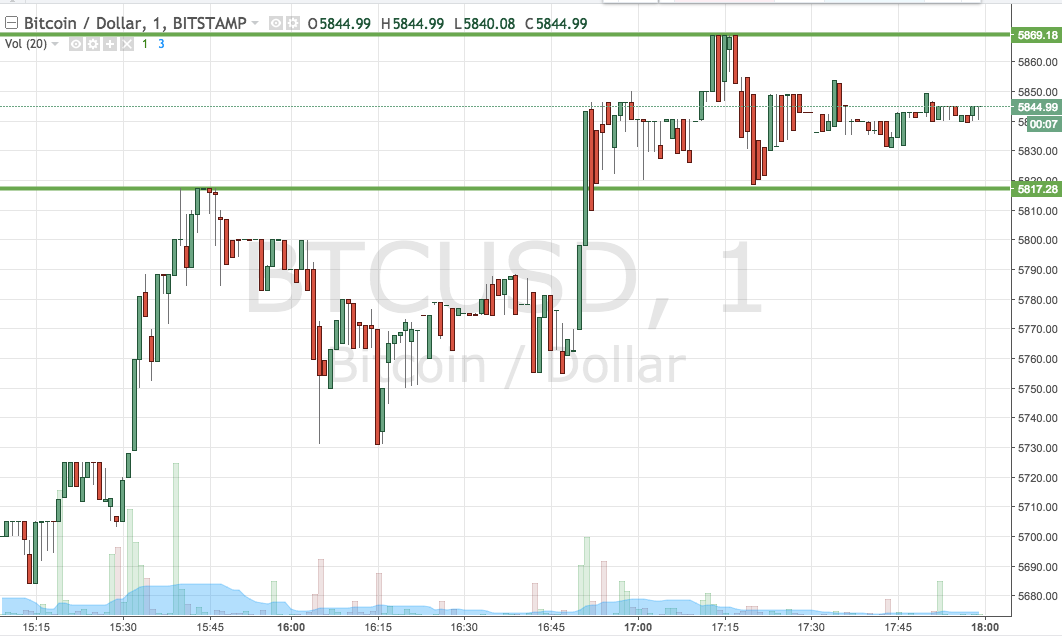

As the chart shows, the range we are using for the session this evening comes in as defined by support to the downside at 5817 and resistance to the upside at 5869. Standard breakout rules apply for now, given that we are working with a range that’s a little too tight to bring our intrarange strategy to the table.
So, if we see price close above resistance, we will enter long towards an immediate upside target of 5910.
Conversely, a close below support will have us in short towards a downside target of 5780.
Stops on both positions limit risk.
Let’s see what happens.
Charts courtesy of Trading View