Markets were a little jittery during the start of the week as the bitcoin price fell foul to a couple of negative fundamental developments (negative, that is, from a sentiment perspective) out of Asia over the weekend. As we said on numerous occasions, however, everyone is looking for an opportunity to buy the dip right now in the bitcoin price space and when we see a correction like the one we just got, we don’t expect it to last too long for that very reason.
Action during the session yesterday traded the bitcoin price down to a little over the 4,200 mark and we opined in our coverage yesterday evening that that might as far as things go from a downside angle.
As it turns out, we were pretty much on the money.
Price settled into a short consolidation phase early morning and we got the breakout we were looking for slightly ahead of the open out of Europe. As we move into the session today, it’s looking like we are in for a green day in the bitcoin price – something that many of the long term holders reading will be happy about.
So, let’s get some levels in place that we can carry into the session. As ever, take a quick look at the chart below before we get started to get an idea of where things stand. It’s a one-minute candlestick chart and it’s got our range overlaid in red.
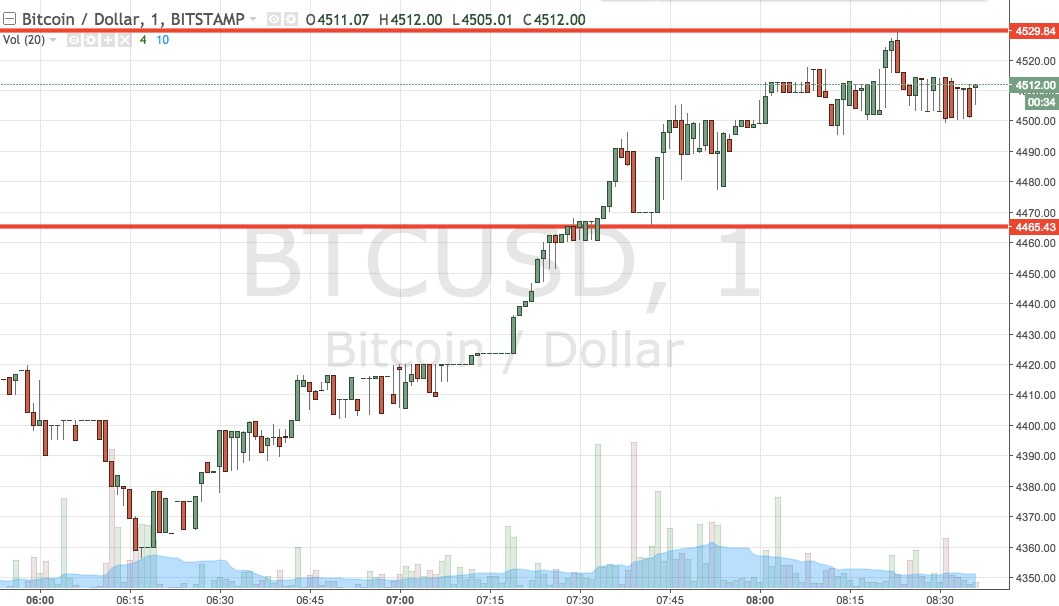

As the chart shows, the range we have in our sights for the session today comes in as defined by support to the downside at 4465 and resistance to the upside at 4529. If we see price close above resistance, we’ll jump in long towards a target of 4560. Conversely, a close below support will have us in short towards 4440.
Let’s see how things play out.
Charts courtesy of Trading View