In yesterday’s bitcoin price analysis, we focused on a head and shoulders pattern (inverse) that was forming on the intraday charts. The pattern suggested that – on completion via the breaking of the neckline – the pattern would give us a target of about $10 north of entry. We did get the break, and entered long as per our strategy. Post-entry, the bitcoin price gained strength, and we ran up towards our target. Unfortunately, before our target struck, price reversed and we ran back down through the entry level to take out our stop loss. Action overnight saw a break recovery, and has formed another technical charting pattern for us to take a look at today. We haven’t had much luck with these patterns as late, so we’re going to mix things up a bit and trade two separate strategies. Concurrently, we’ll implement our breakout strategy according to our traditional key level rules, and trade the technical pattern. Before we go into the details of both strategies, take a quick look at the chart to get an idea of where things stand.
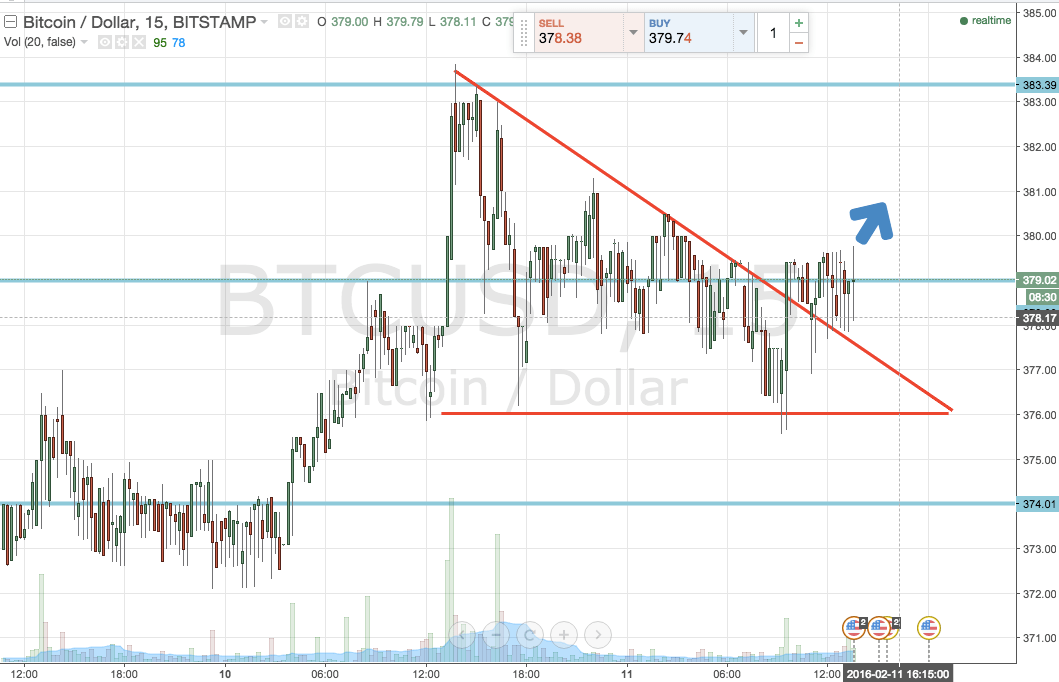

So what’s the pattern? It’s a triangle, and we’re looking for an upside break. When the price of an asset tightens its range between sloping resistance and flat support, it suggests that price is winding up for a move – in a similar fashion to the implications of a tightening range in sideways markets. This scenario has played out in the bitcoin price over the last few hours, and so we are looking for a break through resistance to the upside to mark pattern completion and – in turn – signal entry. A target on these patterns traditionally comes in at an equal distance from the break point to the top of the triangle, which in this case gives us about $8-9 worth of upside. A stop on the trade somewhere in the region of 374 gives us plenty of room to avoid a chop out while still maintaining a positive risk profile for the trade.
So, now let’s get to the breakout strategy. Nothing out of the norm here. The day’s range is defined by in term support at 374 flat and in term resistance at 379. A break of resistance will put us long towards an initial upside target somewhere in the region of 384. A stop loss at 377 keeps things attractive from a risk management perspective.
Looking to the downside, a close below in term support at 374 will signal a short entry towards 369 flat. This is, again, a pretty tight scalp, so an equally tight stop loss is going to be necessary. We’re looking at somewhere in the region of 376 to keep things tight.
Today’s range is a little bit too tight to trade intrarange, but for the more adventurous trader (and for one happy to shave small gains from tight action), long at support on a bounce and short at resistance on a correction. Stop losses on both trades placed just the other side of the entry level (keep them tight!) defines the risk profile.
Charts courtesy of Trading View