We are closing in on the midway point of the week and it’s time to take stock of action in the bitcoin price so far in an attempt to try and figure out where things are likely to go moving forward. During the couple of sessions we have had on Monday and Tuesday, we have seen considerable volatility, but the overarching trend has been to the upside.
With any luck, we will see a continuation of this trend as the session matures on Wednesday.
One thing that we have not been able to do over the last few days is incorporate our intrarange strategy into our approach – purely because action has been so choppy.
Today, however, we hope to change this.
So, as we move into the start of the session, here is a look at where we are looking to jump in and that the markets according to rules of our intraday strategy. As ever, take a quick look at the chart below before we get started so as to get an idea where things stand. It is a one-minute candlestick chart and it has our range overlaid in green.
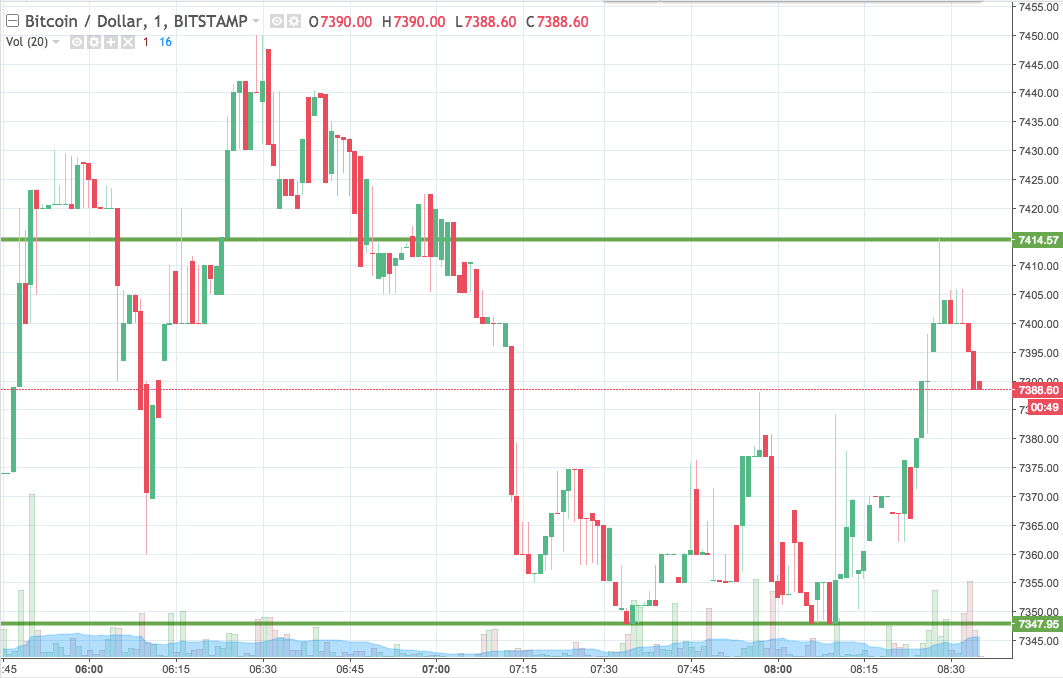

As the chart shows, the range we are using today is defined by support to the downside at 7347 and resistance to the upside at 7414. As mentioned, intrarange is on, so we’ll be in long on a bounce from support and short on a correction from resistance, targeting the opposing levels.
Looking at our breakout strategy, if we see price close above resistance, we will enter long towards an immediate upside target of 7500. A stop loss at 7400 looks good.
Looking the other way, if we see a close below support, we will enter short towards a target of 7280. A stop loss on this one somewhere in the region of 7358 should ensure we are taken out of the trade if things turn against us.
Chart courtesy of Trading View