It is now Tuesday morning, and once again, we have had an excellent night’s worth of trading in the bitcoin price. Things initially looked a little flat as we headed into the late US session; but after a bit of Asian volume mixed into the equation, price broke out to the upside, and we saw that the bitcoin price hit its highest level in months, trading just shy of 740 and correcting only a few dollars post-highs. This bodes well for today’s session, and we are looking forward to getting in and out of the markets, according to our intraday strategy as volatility continues to dominate.
So, with this said, and as we head into today’s session, here is a look at what we are focusing on in the bitcoin price, with an analysis of our key levels, and a discussion of where we are looking to get in and out of the markets if price gives us an opportunity to do so.
As ever, take a look at the chart below to get an idea of what is on. It is a five-minute candlestick chart, and it has the last 12 hours or so worth of action displayed with our key levels overlaid.
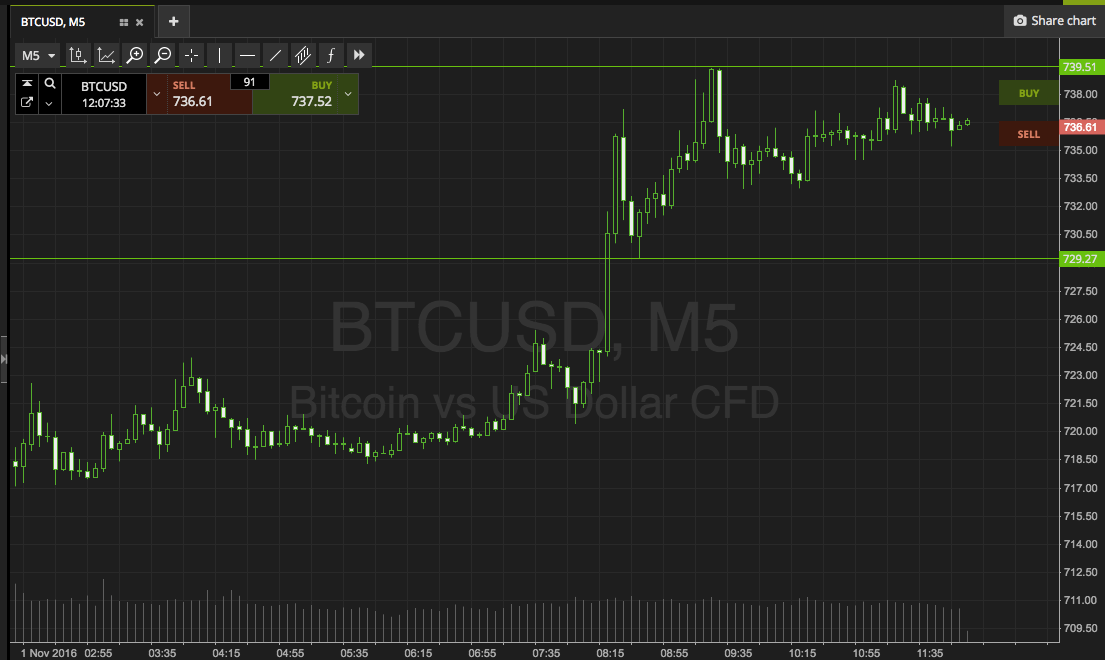

As the chart shows, the levels in focus for today’s morning session are support to the downside at 729, and resistance to the upside at 739. With about $10 worth of range to go at, intrarange is an option today. Looking at breakout, if price breaks above resistance, we will enter long towards an immediate upside target of 747. Conversely, a close below support will signal short towards 720. A stop loss just the other side of the entry in both instances will ensure that we are taken out the trade in the event of a bias reversal.
Let’s see how things play out.
Happy trading!
Charts courtesy of SimpleFX