Once again, let’s kick things of with a chart. The chart below shows the action we saw in the bitcoin price across the Wednesday evening session, and has the range we defined as being the one to watch across the session overlaid.
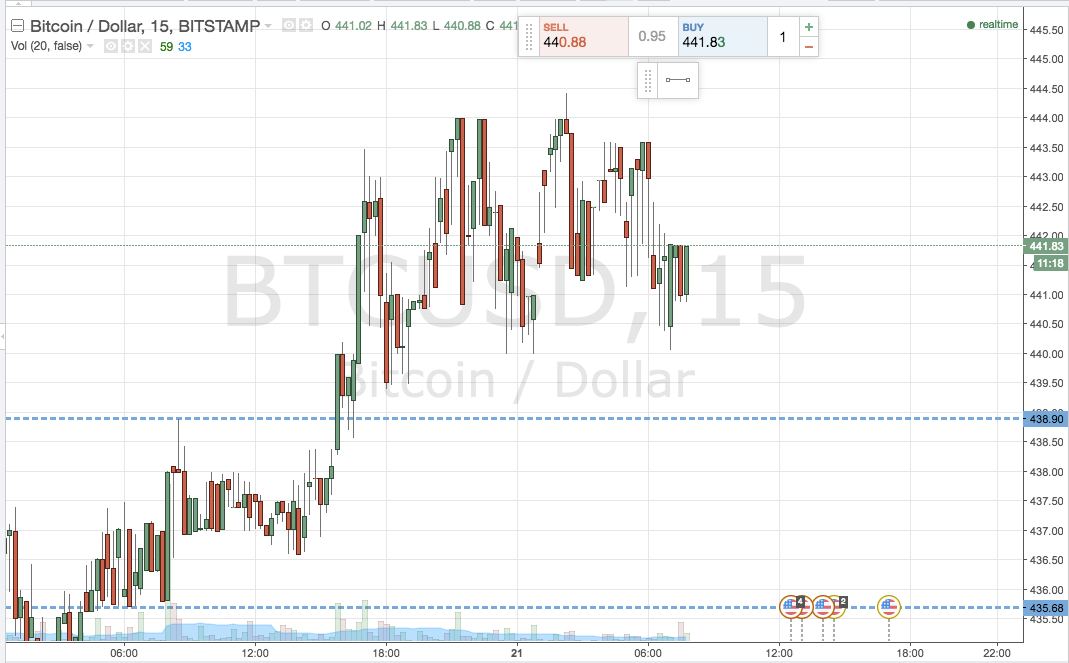

As illustrated, the chart shows price breaking through our pre designated in term support shortly after our publication of the analysis, and pretty much immediately running up to takeout our target (well, a small correction aside) at 444 flat.
Following the breakout, sideways action ensued, as the bitcoin price consolidated and the shorter term speculators took profits from the market.
The overarching trend still seems to be to the upside, but action has been a little bit choppy, so its tough to say whether this will continue throughout the morning session on Thursday. Either way, here’s what we are looking to trade in the bitcoin price this morning. Take a look at the chart below to get an idea of our range, and our targets and stops for the session. It’s a fifteen-minute candlestick chart (the same as above) with a refined range overlaid.
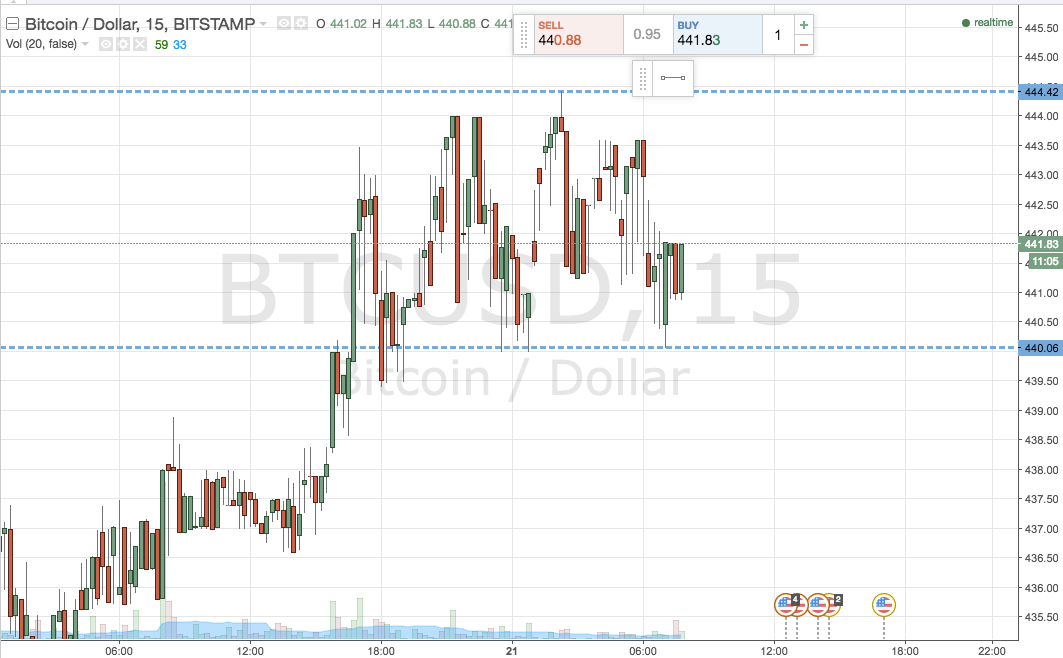

As the chart shows, the range we are looking at now is defined by in term support at 440 flat and in term resistance to the upside at 444.50. It’s a pretty tight range, so we’ll be focusing primarily on our breakout strategy for the session.
More specifically, we’ll look to go long on a break of resistance towards an upside target of 450 (a level we’ve not been able to mention in a while!), with a stop at 442 to define the risk on the position.
Looking short, a close below in term support will signal a short entry towards a downside target of 435 flat. A stop on this one at 442.5 keeps risk tight.
Charts courtesy of Trading View.