Apart from the run up in price we saw on Monday evening and throughout the very early Tuesday morning period, action in the bitcoin price has been relatively flat this week – especially over the last twenty-four hours. We’ve seen plenty of up and down action, but it has been confined between a relatively tight range, and many of the candlesticks that have formed have done so with large wicks and tails, which suggests plenty of indecision in the market. Without the conviction to move price in one way or the other, bulls and bears are at loggerheads, and as soon as we get the beginning of what looks to be any sort of sustained movement, the opposing side of the market reverses action. There is, however, an underlying – albeit weak – trend forming, and it’s apparent through the placing of a sloping channel overlying price. The chart below, which we will get to in a little more detail shortly, highlights this trend.

It’s an upside movement, suggesting that the bulls have a slight edge under current conditions. There’s obviously the potential for a reversal, and a sustained downside spike, but this weak underlying bias affords us the opportunity to be a little bit more aggressive with our upside entry on tonight’s breakout framework.
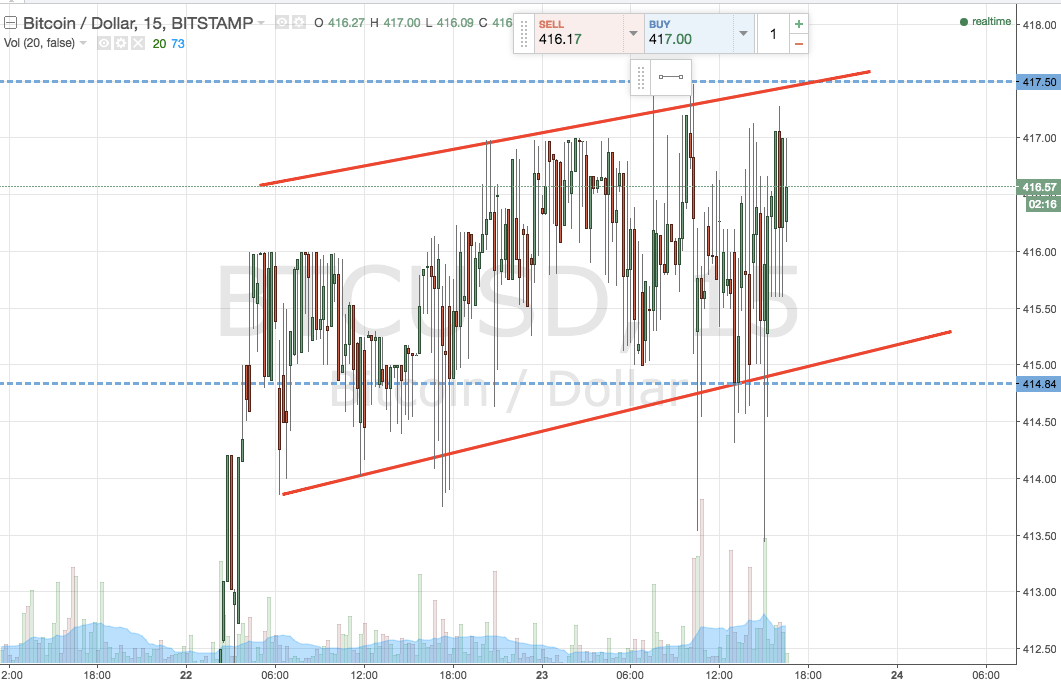
So, getting back to the chart, and said framework, here’s what we are looking at.
In term support comes in at 415 flat, while in term resistance sits at 417.50. As we said this morning, it’s a pretty tight range we’re looking at, so intrarange is off for the time being.
An upside break of in term resistance will signal a long entry towards 422 flat. A stop on the trade at 416 protects our downside.
A downside break of 415 signals short, and a target of 410 versus a stop at 416 gives us a nice risk to reward profile on the trade.
Charts courtesy of Trading View