The trading day has now drawn to a close out of Europe, and it’s time to take a second look at the bitcoin price markets and see if we can’t outline an intraday strategy for this evening’s session out of Asia. Things have been pretty flat today, and since our intrarange strategy was off the table (by way of a narrowed range) we haven’t managed to get into any short term trades. It’s not a problem – at least we haven’t taken any losses – but it’s a little bit boring to sit through, and even more so to read about. With this in mind, let’s quickly move on to the action this evening.
The chart below is an intraday five-minute chart with today’s action displayed as candlesticks across the timeframe. It’s got our range highlighted in green, and it’s going to be what we work from for this evening’s session and – beyond – in to early morning Europe on Wednesday.
So, without further ado, let’s get started.
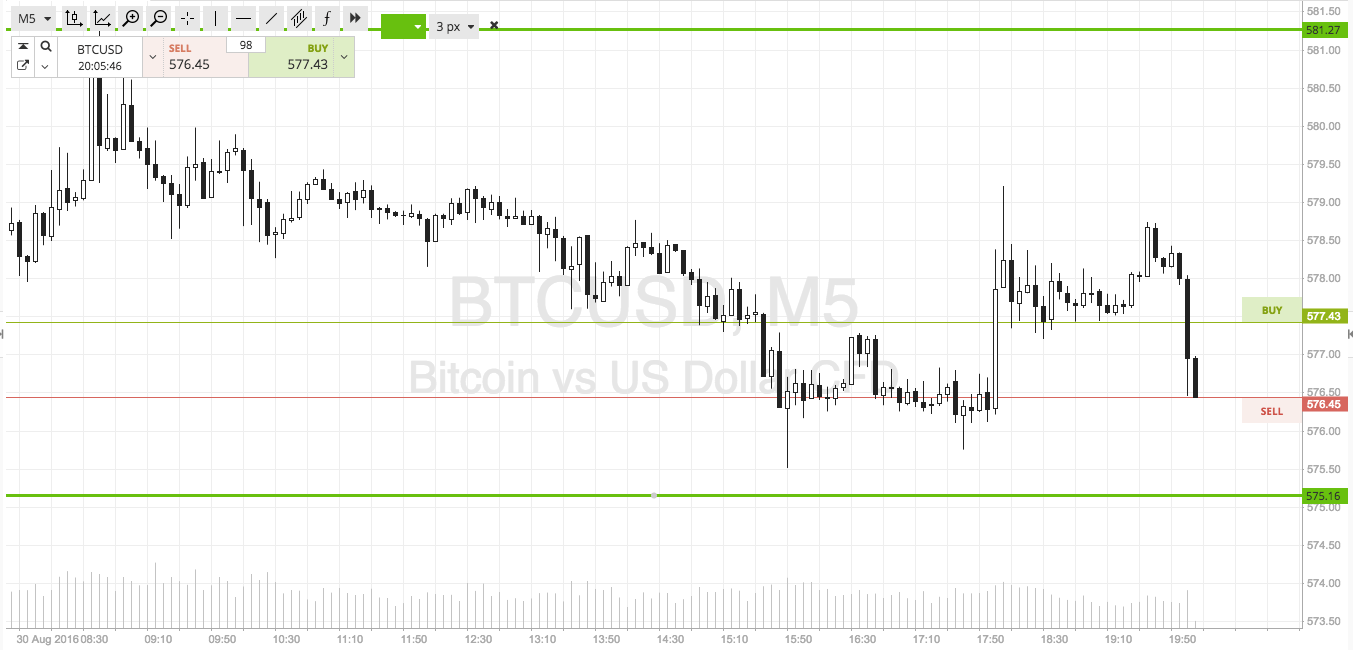

As the chart shows, we are focusing on a range defined by in term support to the downside at 575 flat, and in term resistance to the upside at 581. This range is exactly the same as we outlined this morning (since we haven’t seen any intraday breaks there is no point in changing it around).
As such, we are going to go after some very similar intraday targets this evening. If price breaks and closes above our predefined resistance at 581, we will get in a long position towards an immediate upside target of 587 flat. A stop on the position somewhere in the region of 579 will ensure we are taken out of the trade in the event of a bias reversal.
Conversely, a close below support will signal short towards 568. A stop on this one at 577 defines risk nicely.
Charts courtesy of SimpleFX