At the end of last week, we noted that action in the bitcoin price had been relatively flat for the majority of the week, but that heading into the weekend we might see an increase in volatility, based on some inflated volume. In turn, we suggested that we might see a price rise, and finally get out of the sideways trend that price has been stuck in for what seems like close to a month now. As things turned out, we did see this spike, and action over the weekend has given us plenty to go at for today’s session of Europe.
So, with this in mind, and as we head into a fresh European session today, let’s take a look at the bitcoin price price, and see if we can outline some key levels with which we can get in and out of the markets according to our intraday strategy.
As ever, take a quick look at the chart below in order to get an idea of where we are looking. It is a five-minute candlestick chart showing overnight action.
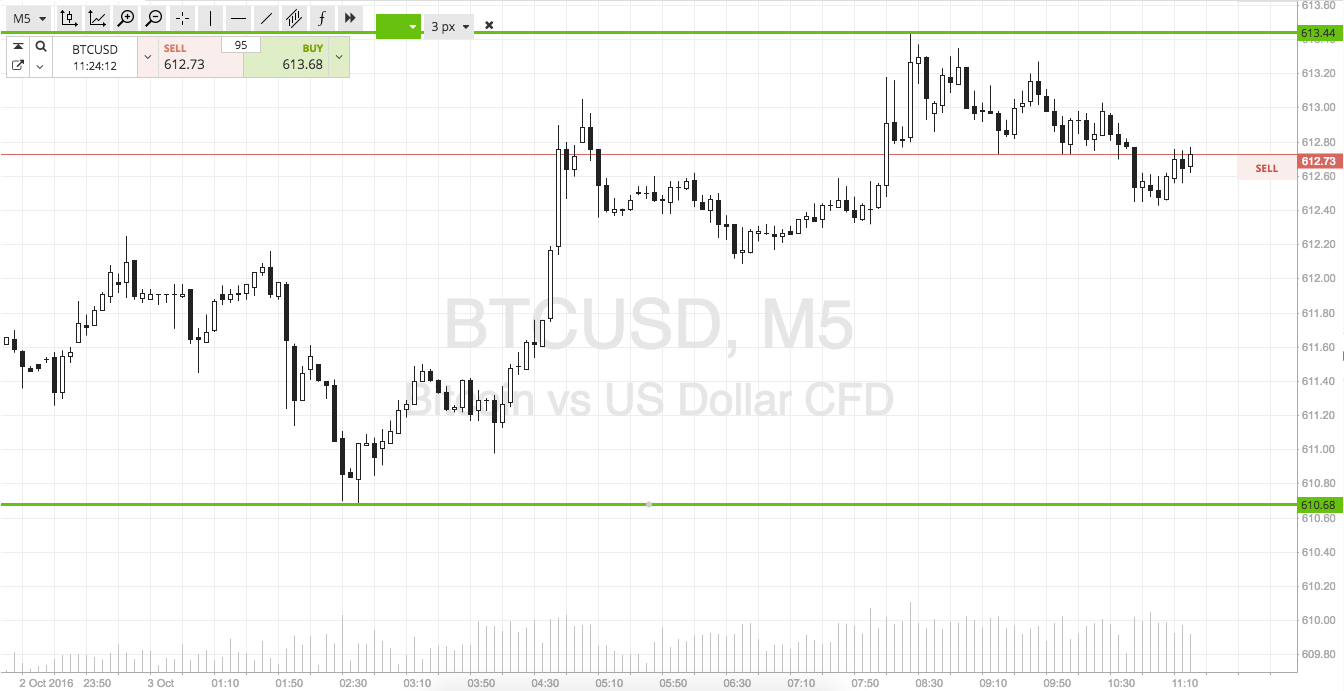

So, as the chart shows, the levels that the define today’s rage are support to the downside at 610, and resistance to the upside at 640. With about four dollars’ worth of range to go at, we are not going to be trading intrarange today. Instead, we are just going to stick with our breakout strategy.
If price breaks below support to the downside we are going to get in to a short position towards an immediate downside target of 605. Conversely, a break above resistance will put as long towards 620. On both positions we need a stop loss to ensure that we are taken out of the trade in the event of a bias reversal. Somewhere in the region of two or three dollars just the other side of the entries works well.
Happy Trading!
Charts courtesy of SimpleFX