

Well, we’re here again – the final day’s trading in a what has been a pretty volatile week in the bitcoin price.Action across the last few days has given us plenty to discuss, and some decent momentum has given us plenty to pick up profits from. Whether this will continue for today’s session remains to be seen – we know that overnight action certainly implies some volatility (and with it, an upside bias), but of course, this means little in this space. Things could quickly reverse on an alteration of sentiment, and so we’ve got to be wary about going in with a bias. Best we can hope for is it falls in line with a little more aggression on the trade – we’ll see.
So, with that said, and with two more analyses set for the final day of the week, here’s what we are looking to trade, and where we are looking to get in and out of the markets if action affords us an opportunity to do so.
First up, hget a quick look at the chart to get an idea of the range in focus.
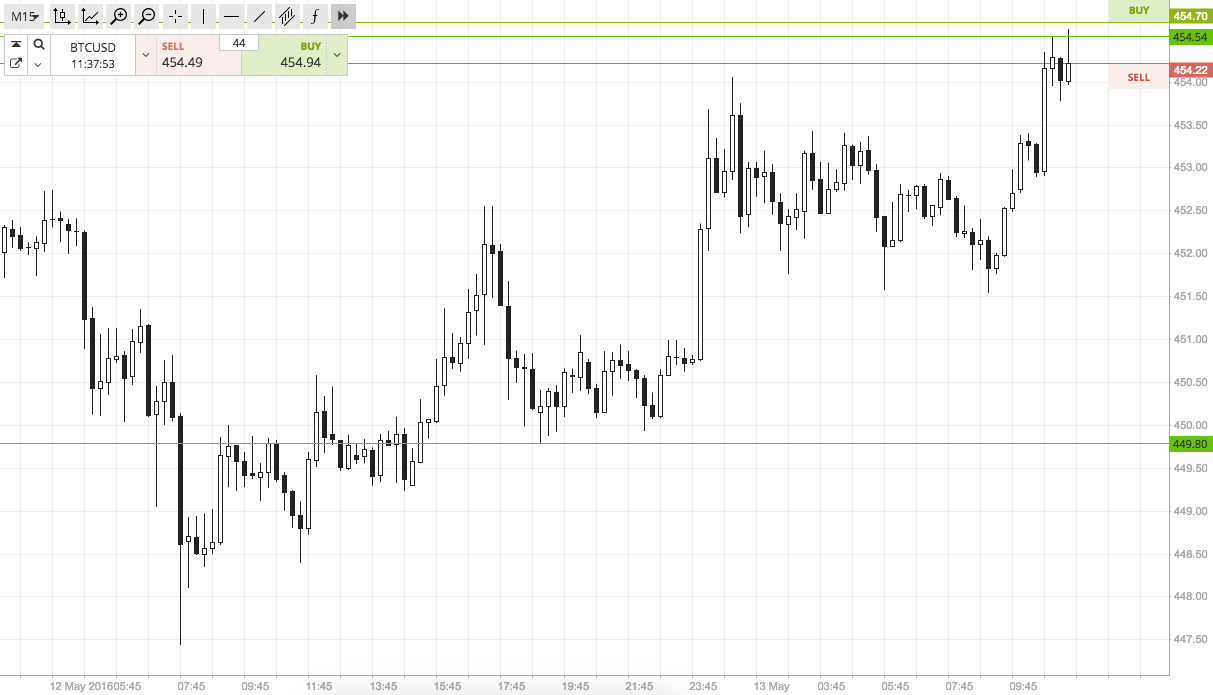

As the chart shows, the range we are looking at today is defined by in term support at 450 flat to the downside, and in term resistance to the upside at 454.5. This latter level represents the most recent swing high, and we are currently trading just shy of this level (hence the above mentioned bullish bias).
So, as ever, a close below in term support on the fifteen-minute candlestick chart will put us short. The target we’ll go for on this one initially is 445 flat, with a stop on the two to one scale at 452.5.
Looking long, a close ablove 454.5 signals long towards 461. A stop on this one somewhere in the region of 452.5 works well to keep risk attractive.
Charts courtesy of SimpleFX
Image Header NewsBTC