Its that time again, the end of the week, and time to put forward the framework with which we are going to approach the weekend in the bitcoin price. Things have been relatively inactive to day so far, but we did get in a short trade on a break of support a little earlier on this afternoon. Unfortunately, the trade didn’t work out, and price returned to trade within range shortly after we entered the position and – in doing so – took us out for a stop loss hit. As we mentioned this morning, however, the weekend (and especially Sunday) has been good to us over the last month or so, with plenty of volatility likely initiated by high volume out of Asia.
With any luck, we’ll get a repeat of this phenomenon, and can pull a profit from the markets to kick off next week’s trading on a positive note. For this evening, we are not going to switch things up too much. Action, as we’ve said, has been pretty flat today, so all we need to do is shift our key levels to accommodate the most recent swing points, and assign some risk parameters to keep protect our downside. To get an idea of what’s on, take a quick look at the chart below. It’s a fifteen minute intraday, showing candlesticks from the last two days’ worth of action.
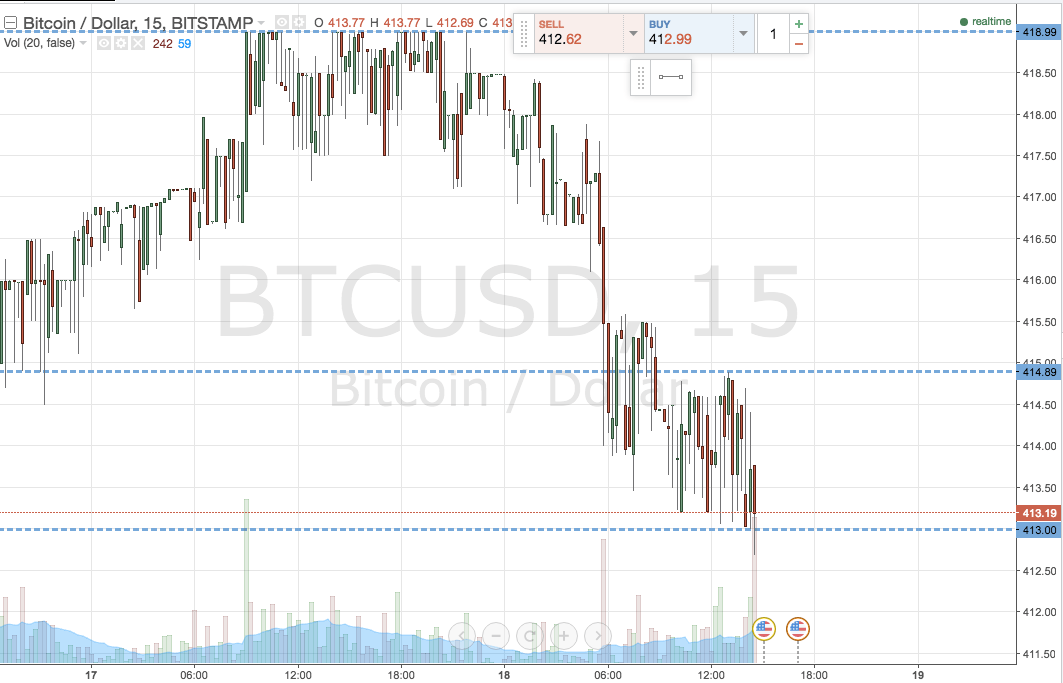

As the chart shows, we’ve shifted our range down slightly, dropping in term support to the most recent swing low at 413 flat, and in term resistance to 415 flat.
An upside position will signal if the bitcoin price breaks above in term resistance, and we will target 419 flat with a stop loss at 413.5 to define our risk on the entry.
Conversely, we’ll enter short on a break of support. Target at 409, stop at 414.
Have a good weekend!
Charts courtesy of Trading View