Here we go then. Another week’s worth of trading under our belt in the bitcoin price, and a fresh week ahead of us. At the end of last week, we set up against some slightly wider than normal weekend action. We looked at the hourly charts as opposed to the minute charts, and put a framework in place that was designed to take advantage of any longer-term weekend volatility – that is, something slightly outside of the traditional intraday momentum. As things turned out, this strategy worked pretty well. Action over the weekend was nice and volatile, and we saw price from fresh highs, before breaking to overnight lows on Sunday, and bringing us into some pretty solid sideways action early morning on Monday. The question is now, how can we use this action to set up against today’s price? To get the answer, take a look at the image below. It is a five-minute candlestick chart, and it illustrates last night’s action as well as our range for today.
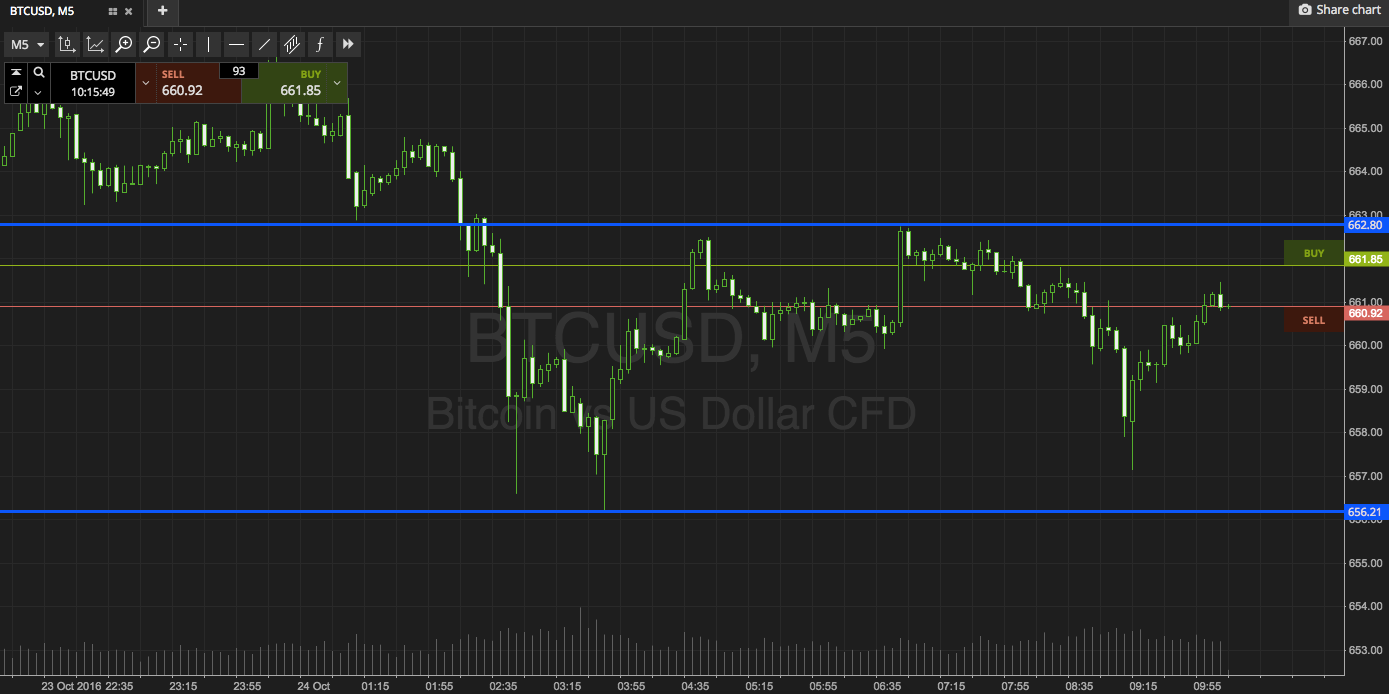

As the chart shows, the range we are focusing on this morning is defined by support to the downside at 656, and resistance to the upside at 662. This range is just about wide enough for us to go at price from intrarange perspective, so if price bounces from support, we will enter long towards resistance, and conversely, if it corrects from resistance we will enter short towards support.
Looking at our breakout strategy, a break above resistance will put us on the lookout for a close, and if we see the candlestick close above this level, we will get in long towards an immediate upside target of 670.
Looking the other way, a close below support will signal short towards 650. In both situations, a stop loss somewhere in the region of one or two dollars just the other side of the entry defines risk nicely.
Happy Trading!
Charts courtesy of SimpleFX