So, we have come to the end of the week in our bitcoin price trading efforts and it’s looking as though we are going to have a pretty interesting close to the session. Things started moving late yesterday and we were able to jump into the markets on a nice clean breakout trade shortly before the US session closed out. As the chart below will show, action has not stopped appreciating overnight in Europe and price is now hovering in and around fresh all-time highs just below $7900. The hope is that this upside run will continue, but we’ve got to be aware that there is a chance we will see some degree of correction near term. If that happens, we will be ready to jump in short on a corrective downside entry.
if not, we will maintain our upside trajectory and stick with the markets as they are.
So, with this noted, let’s get some levels in place that we can use to execute on this above-described strategy as and when it plays out. As ever, take a quick look at the chart below before we get started so as to get an idea where things stand and where we are looking to jump in and out of the markets if things move during the session today. It is a one-minute candlestick chart and it has our range overlaid in green.
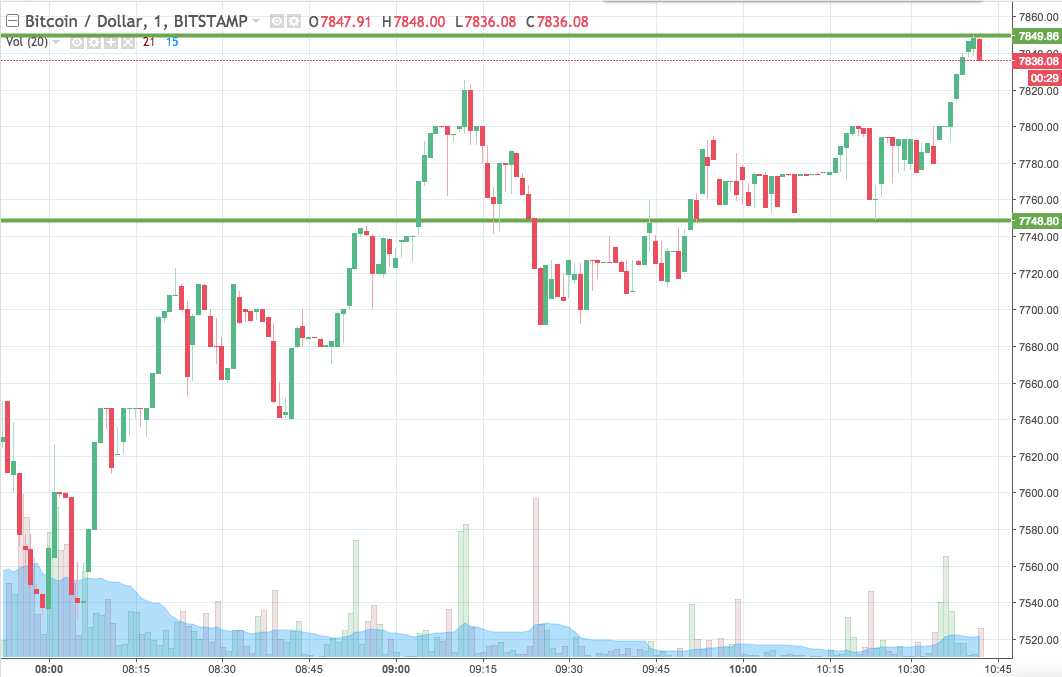

As the chart shows, the range we are looking at for the session today comes in as defined by support to the downside at 7748 and resistance to the upside at 7849.
If we see price close above resistance, we will enter long towards an immediate upside target of 7930. Conversely, a close below support will have us in short towards a downside target of 7700. Stop losses on both trades will take us out of the positions in the event of a bias reversal.
Charts courtesy of Trading View