The past week was full of action on the (BTC/USD) charts. Although the week started by a bearish wave that took bitcoin price down to around $231, a rather strong bullish wave took the price up to $263 yesterday. So, let’s take a look at the week’s charts to better understand the current market trend.
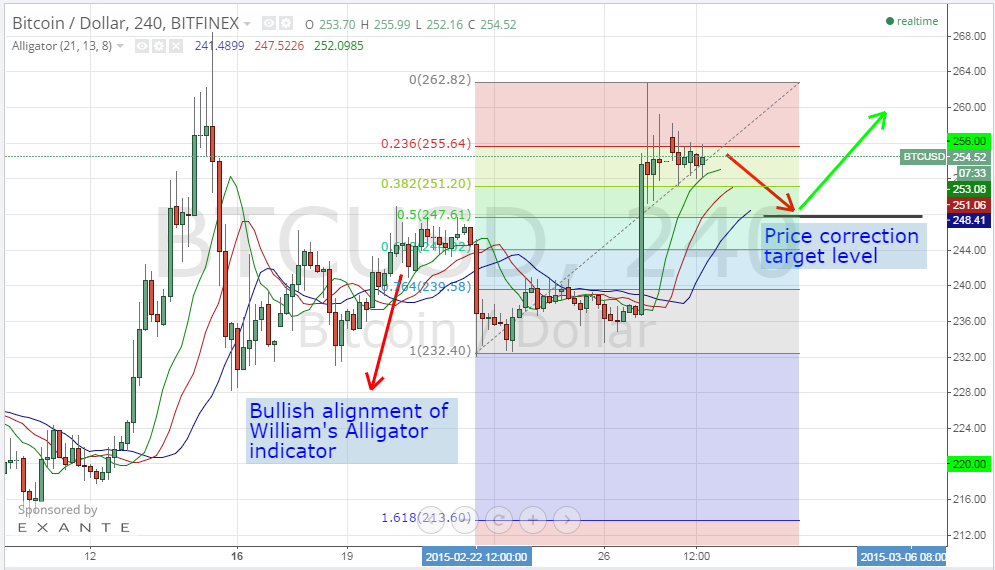
Let’s take a look the 4 hour Bitfinex (BTC/USD) charts from tradingview.com, plot the William’s Alligator indicator and draw Fibonacci retracements across a trend line that extends from the low recorded on the 22nd of February ($232) and the high recorded yesterday ($263) (look at at the below chart). We can conclude the following:
- Before yesterday’s bullish rally, bitcoin price was getting good support at around $232. During today’s trading sessions price has been facing resistance at $255.64 which coincides with the 23.6% Fibonacci retracement level.
- Bitcoin price can drop to around 50% of the recent rise in bitcoin price to around $248 at the 50% Fibonacci retracement level, before rising up again to test the 23.6% Fibonacci retracement level at around $256.
- The moving averages of William’s Alligator indicator signaled an upcoming bullish wave on the 20th of February before yesterday’s rally ensued. Right now, the moving averages of the William’s Alligator indicator are also aligned perfectly to signal an upcoming bullish wave, so we expect bitcoin price to rise to retest the $256 resistance level some time during next week.
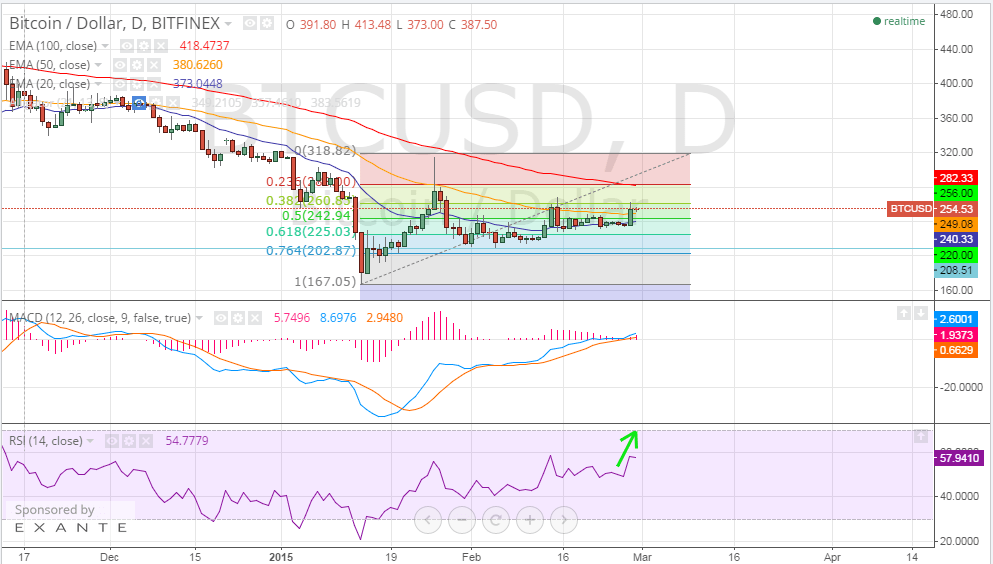
By studying the 1 day Bitfinex (BTC/USD) chart from tradingview.com, plotting the 20, 50 and 100 day EMAs, plotting the MACD indicator and executing the RSI (look at the below chart), we can conclude the following:
- We can draw Fibonacci retracements across a trend line that extends between the low reached on the 14th of January and the high reached on the 26th of January. Right now, price is facing resistance at the 38% retracement level.
- The MACD indicator entered the positive territory and the blue MACD line crossed above the red signal line right before the bullish rally started yesterday. Continuation of this MACD alignment means that the bullish wave will mostly continue to take the price to the 38% retracement level again during the next few days.
- Bitcoin price is now above the 20 and 50 day EMAs and has been so since yesterday. If the price continues to be above those EMAs, this is in favor of continuation of yesterday’s bullish wave.
- The RSI is sloping in an upward direction and is valued around 59 at the moment, so bitcoin is not overbought and we can see it rise again during next week to attempt breaking out of the $260 level.
Conclusion:
Bitcoin price broke out of the bearish trend that has been controlling the market throughout the past few weeks. Our technical analysis is in favor of continuation of the new bullish trend so that we can see the price exceed $260 next week. Generally speaking, if the charts continue to display bullish signs, we can see the $300 resistance level tested during the upcoming couple of weeks.
Charts from bitfinex