

Key Points
- Bitcoin price remains in a super bullish trend above $10,000 against the US Dollar.
- There are two bullish trend lines forming with supports at $10,300 and $9200 on the 4-hours chart of BTC/USD (data feed from SimpleFX).
- The pair is currently trading in a range above the $10,500 level and is preparing for more gains.
Bitcoin price is very bullish above the $9500 level against the US Dollar. BTC/USD might soon break $11,200 for more gains in the near term.
Bitcoin Price Bullish Trend
It was an amazing week for bitcoin price as it moved above the $10,000 and $11,000 levels against the US Dollar. The upside move was very strong and the price traded as high as $11,386 before it faced sellers. The price corrected sharply lower, but downsides were limited by the $9000 level. There were strong bids near the mentioned level $9000, and the price recovered well.
It moved back above the $10,500 level and is currently trading around the $10,800 level. It seems like the price is consolidating and preparing for more gains above $11,000. Once there is a break above a bearish trend line at $11,200, there are chances of BTC moving past $11,400 in the near term. The next major target could be $12,000. On the downside, there are two bullish trend lines forming with supports at $10,300 and $9200 on the 4-hours chart of BTC/USD.
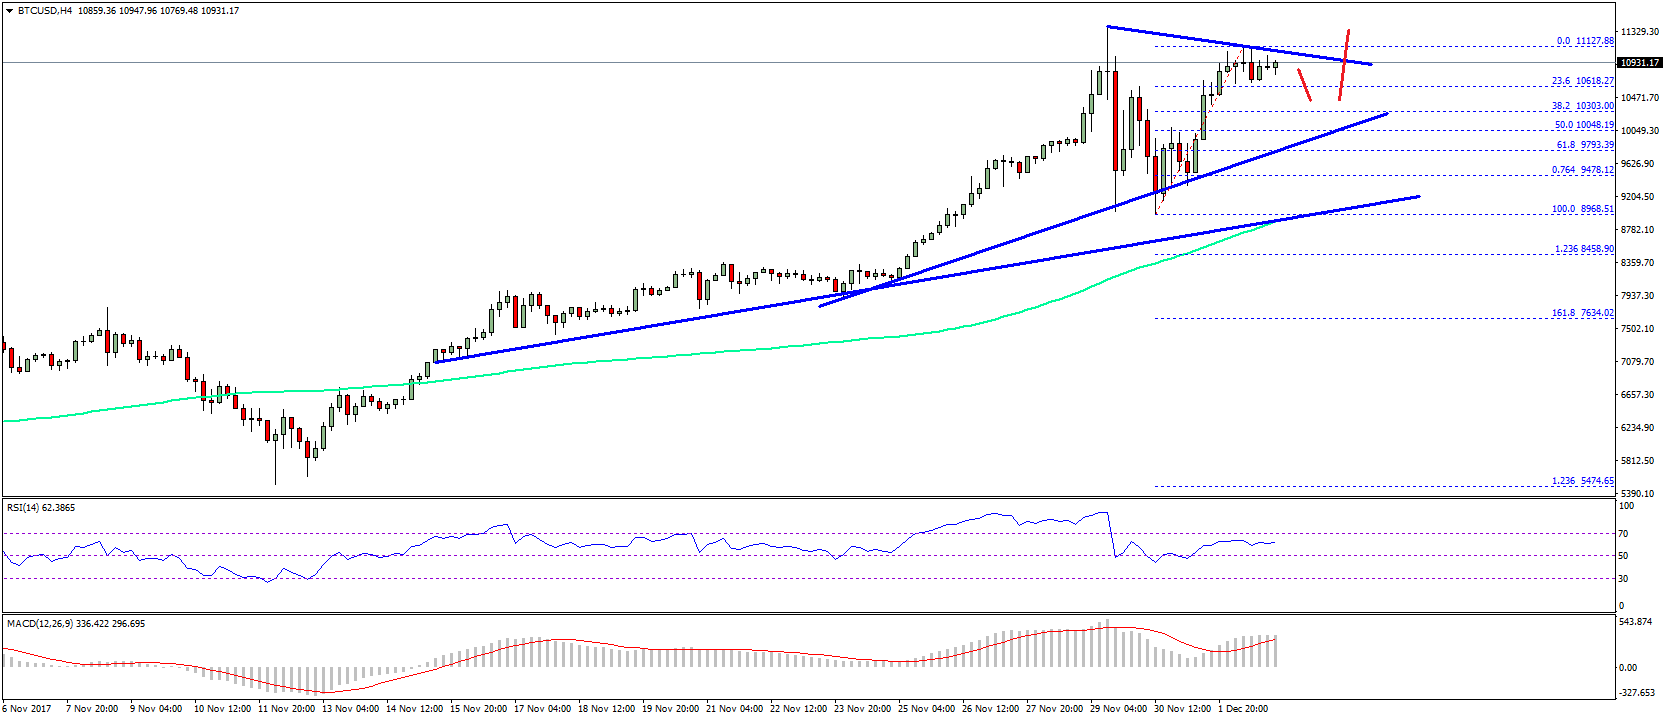
The second trend line is the most important above $9200 since it is near the 100 simple moving average (4-hours). As long as the price is above the $9000-10,000 levels, it remains in an uptrend. Upsides targets are $11,800 and $12,000 in the near term.
Looking at the technical indicators:
4-hours MACD – The MACD is placed nicely in the bullish zone.
4-hours RSI (Relative Strength Index) – The RSI is currently well above the 50 level and is slowly moving higher.
Major Support Level – $9200
Major Resistance Level – $12000
Charts courtesy – SimpleFX