Key Points
- Bitcoin price is in a major uptrend and recently broke the $5600 resistance against the US Dollar.
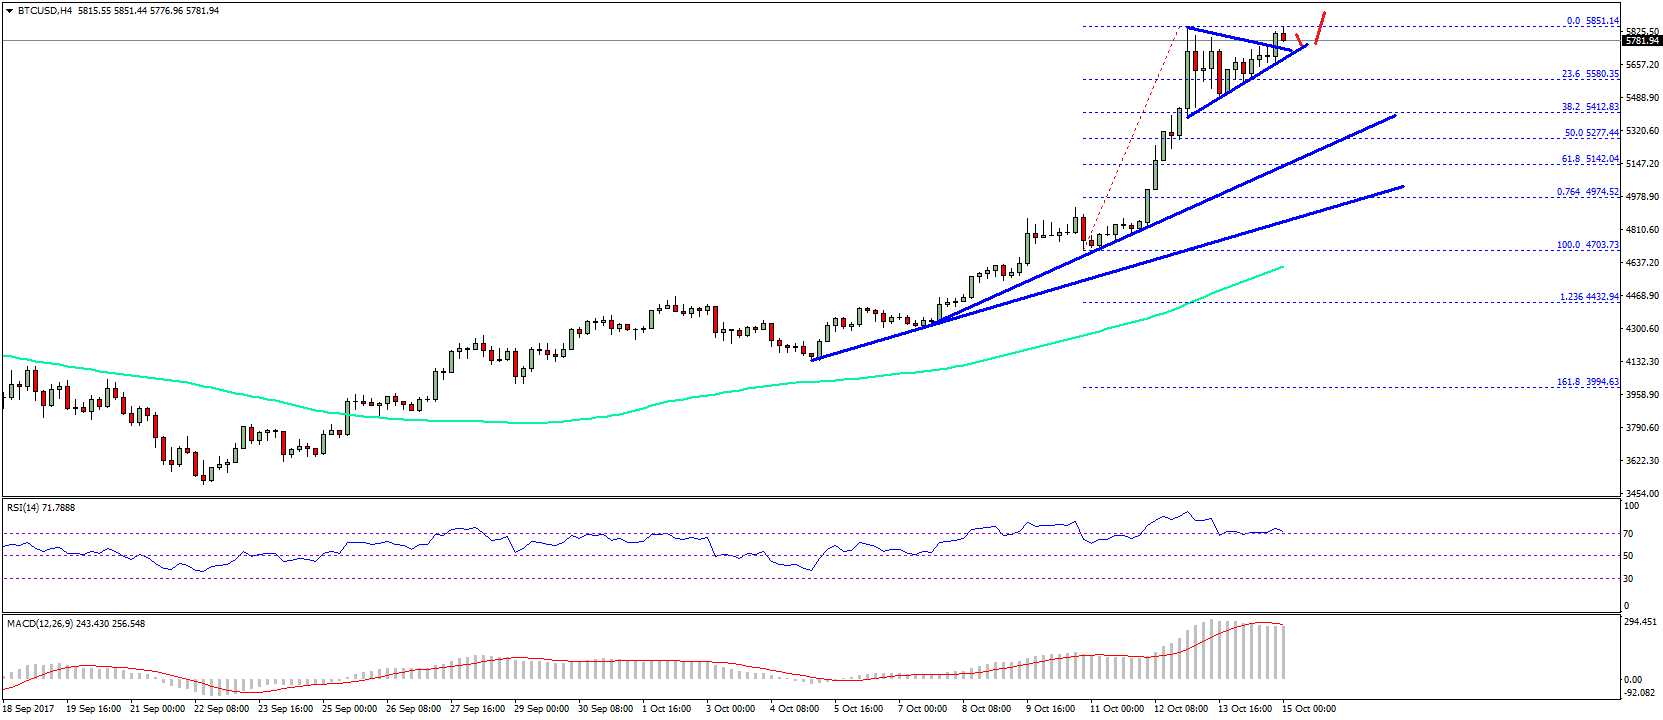
- There are two major bullish trend lines forming with support at $5280 and $5000 on the 4-hours chart of BTC/USD (data feed from SimpleFX).
- The pair might continue to trade higher and could even break the recent high of $5851.
Bitcoin price is surging higher against the US Dollar. BTC/USD is now set to gain momentum for more gains above $5850 and $6000.
Bitcoin Price Bullish Trend
There were nasty gains in Bitcoin price this past week as it moved above the $5500 and $5600 resistance levels against the US Dollar. A new all-time high was formed at $5851 and it seems like the current uptrend is not over yet. The price might continue to trade higher and could break the $5851 resistance for more gains. Recently, there was a minor dip from the current levels and the price moved below the 23.6% Fib retracement level of the last wave from the $4703 low to $5851 high.
However, the downside move was prevented by $5450 and the 38.2% Fib retracement level of the last wave from the $4703 low to $5851 high. The pair formed a contracting triangle pattern with resistance at $5700. There was a break above it recently and the price is now set for more gains above $5800. On the downside, there are two major bullish trend lines forming with support at $5280 and $5000 on the 4-hours chart of BTC/USD.
The current trend is likely to continue and if buyers remain in control, there are chances of a break above $6000. Above $6000, the next hurdle is close to $6150.
Looking at the technical indicators:
4-hours MACD – The MACD is placed well in the bullish zone.
4-hours RSI (Relative Strength Index) – The RSI is correcting the overbought levels.
Major Support Level – $5600
Major Resistance Level – $5850
Charts courtesy – SimpleFX