

Key Points
- Bitcoin price surged higher this past week and broke $7,500 resistance against the US Dollar.
- There was a break above a key bearish trend line with resistance at $7,600 on the 4-hours chart of the BTC/USD pair (data feed from Kraken).
- The pair is currently trading above $8,000 and is facing a monster resistance near the $8,500 level.
Bitcoin price is trading in a bullish zone above $7,500 against the US Dollar. BTC/USD has to move above $8,500 to extend gains in the near term.
Bitcoin Price Trend
This past week, there was a sharp upside move in bitcoin price from the $6,800 swing low against the US Dollar. The price surged higher and broke many resistances on the way up such as $7,000 and $7,500. There was also a break above the 38.2% Fib retracement level of the last decline from the $9,025 swing high to $6,450 swing low, which is a positive sign.
More importantly, there was a break above a key bearish trend line with resistance at $7,600 on the 4-hours chart of the BTC/USD pair. The pair is now trading well above the $7,000 level and the 100 simple moving average (4-hours). Furthermore, the price settled above the 61.8% Fib retracement level of the last decline from the $9,025 swing high to $6,450 swing low. However, it is facing a monster hurdle on the upside near the $8,500 level. It acted as a support earlier and the stated $8,500 will most likely prevent upsides in the near term. If BTC buyers succeed in pushing the price above the $8,500 level, there could be a test of the last swing high near $9,025.
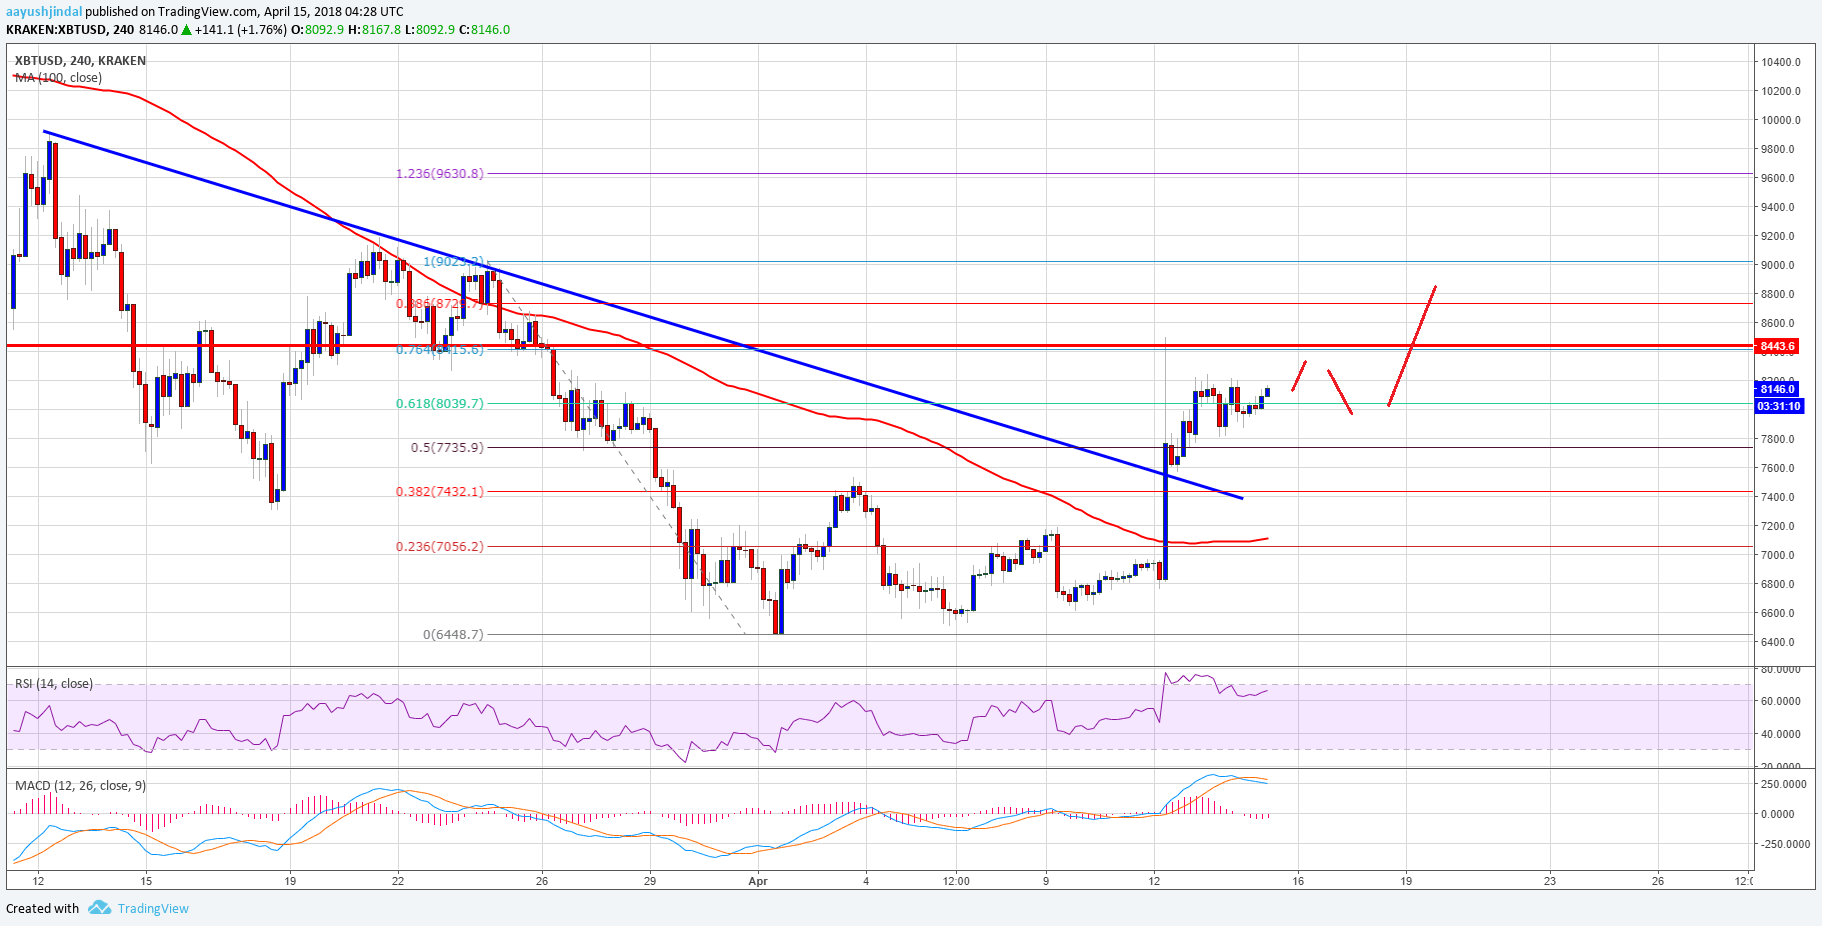

Looking at the chart above, the pair is positioned nicely above the $7,500 pivot level. It may continue to trade higher if it succeeds in clearing the $8,500 barrier. On the downside, supports are visible near $7,800, $7,600 and $7,500.
Looking at the technical indicators:
4-hours MACD – The MACD for BTC/USD is placed nicely with positive signs.
4-hours RSI (Relative Strength Index) – The RSI is currently well above the 60 level.
Major Support Level – $7,500
Major Resistance Level – $8,500