Key Points
- Bitcoin price failed once again around the $4450 level against the US Dollar, and currently trading near $4350.
- There is a crucial bullish trend line with support at $4280 forming on the 4-hours chart of BTC/USD (data feed from SimpleFX).
- As long as the price is above the trend line support at $4280, it may retest $4450.
Bitcoin price is struggling to clear the $4450-4500 levels against the US Dollar. A break above $4500 in BTC/USD is needed for $5000 in the near term.
Bitcoin Price Trend Support
Bitcoin price made a nice upside move this past week and traded towards the last high of $4470 against the US Dollar. The price traded as high as $4450 where it faced sellers and started a correction. The price traded below the 23.6% Fib retracement level of the last wave from the $4070 low to $4450 high. However, the downside move was contained by the $4250 support zone.
The 50% Fib retracement level of the last wave from the $4070 low to $4450 high at $4260 prevented declines. The price is now slowly moving higher above $4300, but lacking pace. There is a crucial bullish trend line with support at $4280 forming on the 4-hours chart of BTC/USD. The highlighted trend line support at $4280-4260 could play a major role for the next move in the near term.
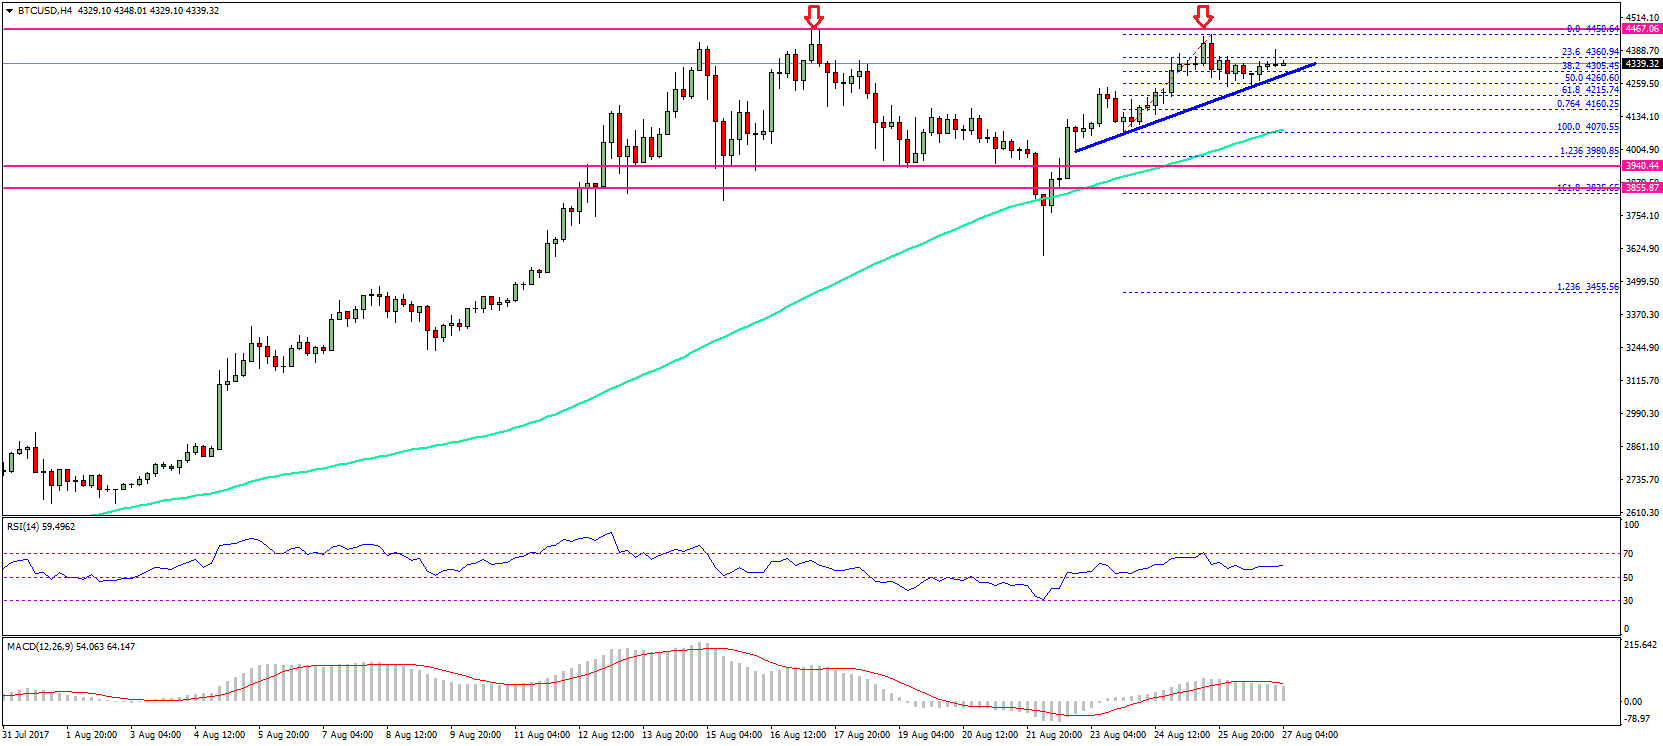
As long as the price is above the $4280-4260 support area, it might retest the last swing high at $4450. On the flipside, if there is a break and close below $4250, the price could test $4100. Moreover, the 100 simple moving average on the same chart is near $4070, which is critical support. Overall, the next move depends whether the price can hold the trend line and support at $4250 or not.
Looking at the technical indicators:
4-hours MACD – The MACD is still moving into the bullish zone.
4-hours RSI (Relative Strength Index) – The RSI is also well above the 50 level.
Major Support Level – $4250
Major Resistance Level – $4450
Charts courtesy – SimpleFX